Tropical Cyclone Report - National Hurricane Center - NOAA
Tropical Cyclone Report - National Hurricane Center - NOAA
Tropical Cyclone Report - National Hurricane Center - NOAA

You also want an ePaper? Increase the reach of your titles
YUMPU automatically turns print PDFs into web optimized ePapers that Google loves.
Wind Speed (kt)<br />
110<br />
100<br />
90<br />
80<br />
70<br />
60<br />
50<br />
40<br />
30<br />
20<br />
BEST TRACK<br />
Sat (TAFB)<br />
Sat (SAB)<br />
ADT<br />
AC (sfc)<br />
AC (flt->sfc)<br />
AC (DVK P->W)<br />
Scatterometer<br />
Surface<br />
Drop (sfc)<br />
Drop (LLM xtrp)<br />
AMSU<br />
Analysis<br />
10<br />
8/20 8/22 8/24 8/26 8/28 8/30 9/1<br />
Date (Month/Day)<br />
<strong>Hurricane</strong> Isaac<br />
21 August - 1 September 2012<br />
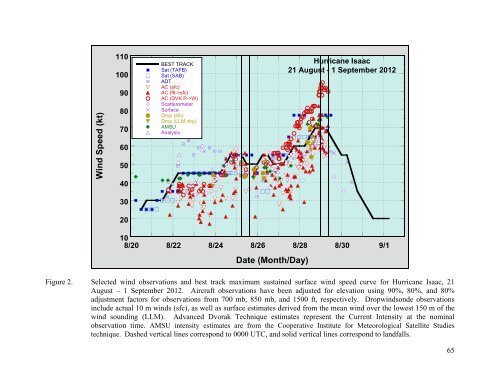
Figure 2. Selected wind observations and best track maximum sustained surface wind speed curve for <strong>Hurricane</strong> Isaac, 21<br />
August – 1 September 2012. Aircraft observations have been adjusted for elevation using 90%, 80%, and 80%<br />
adjustment factors for observations from 700 mb, 850 mb, and 1500 ft, respectively. Dropwindsonde observations<br />
include actual 10 m winds (sfc), as well as surface estimates derived from the mean wind over the lowest 150 m of the<br />
wind sounding (LLM). Advanced Dvorak Technique estimates represent the Current Intensity at the nominal<br />
observation time. AMSU intensity estimates are from the Cooperative Institute for Meteorological Satellite Studies<br />
technique. Dashed vertical lines correspond to 0000 UTC, and solid vertical lines correspond to landfalls.<br />
65