Tropical Cyclone Report - National Hurricane Center - NOAA
Tropical Cyclone Report - National Hurricane Center - NOAA
Tropical Cyclone Report - National Hurricane Center - NOAA

Create successful ePaper yourself
Turn your PDF publications into a flip-book with our unique Google optimized e-Paper software.
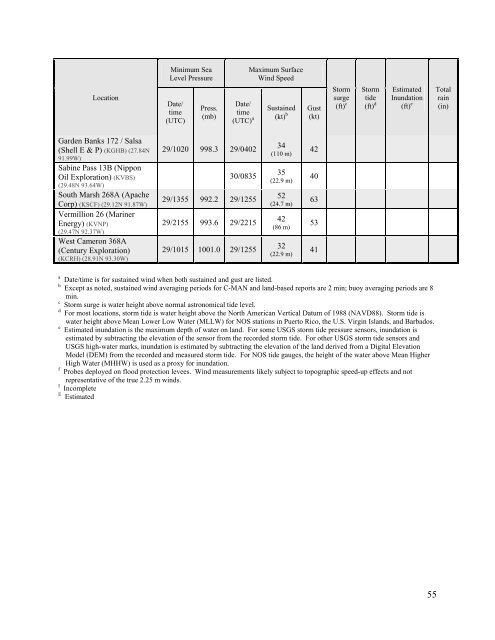
Location<br />
Garden Banks 172 / Salsa<br />
(Shell E & P) (KGHB) (27.84N<br />
91.99W)<br />
Sabine Pass 13B (Nippon<br />
Oil Exploration) (KVBS)<br />
(29.48N 93.64W)<br />
South Marsh 268A (Apache<br />
Corp) (KSCF) (29.12N 91.87W)<br />
Vermillion 26 (Mariner<br />
Energy) (KVNP)<br />
(29.47N 92.37W)<br />
West Cameron 368A<br />
(Century Exploration)<br />
(KCRH) (28.91N 93.30W)<br />
Minimum Sea<br />
Level Pressure<br />
Date/<br />
time<br />
(UTC)<br />
Press.<br />
(mb)<br />
Date/<br />
time<br />
(UTC) a<br />
29/1020 998.3 29/0402<br />
30/0835<br />
29/1355 992.2 29/1255<br />
29/2155 993.6 29/2215<br />
29/1015 1001.0 29/1255<br />
Maximum Surface<br />
Wind Speed<br />
Sustained<br />
(kt) b<br />
34<br />
(110 m)<br />
35<br />
(22.9 m)<br />
52<br />
(24.7 m)<br />
42<br />
(86 m)<br />
32<br />
(22.9 m)<br />
Gust<br />
(kt)<br />
42<br />
40<br />
63<br />
53<br />
41<br />
Storm<br />
surge<br />
(ft) c<br />
Storm<br />
tide<br />
(ft) d<br />
Estimated<br />
Inundation<br />
(ft) e<br />
a<br />
Date/time is for sustained wind when both sustained and gust are listed.<br />
b<br />
Except as noted, sustained wind averaging periods for C-MAN and land-based reports are 2 min; buoy averaging periods are 8<br />
min.<br />
c<br />
Storm surge is water height above normal astronomical tide level.<br />
d<br />
For most locations, storm tide is water height above the North American Vertical Datum of 1988 (NAVD88). Storm tide is<br />
water height above Mean Lower Low Water (MLLW) for NOS stations in Puerto Rico, the U.S. Virgin Islands, and Barbados.<br />
e<br />
Estimated inundation is the maximum depth of water on land. For some USGS storm tide pressure sensors, inundation is<br />
estimated by subtracting the elevation of the sensor from the recorded storm tide. For other USGS storm tide sensors and<br />
USGS high-water marks, inundation is estimated by subtracting the elevation of the land derived from a Digital Elevation<br />
Model (DEM) from the recorded and measured storm tide. For NOS tide gauges, the height of the water above Mean Higher<br />
High Water (MHHW) is used as a proxy for inundation.<br />
f<br />
Probes deployed on flood protection levees. Wind measurements likely subject to topographic speed-up effects and not<br />
representative of the true 2.25 m winds.<br />
I<br />
Incomplete<br />
E Estimated<br />
55<br />
Total<br />
rain<br />
(in)