Tropical Cyclone Report - National Hurricane Center - NOAA
Tropical Cyclone Report - National Hurricane Center - NOAA
Tropical Cyclone Report - National Hurricane Center - NOAA

Create successful ePaper yourself
Turn your PDF publications into a flip-book with our unique Google optimized e-Paper software.
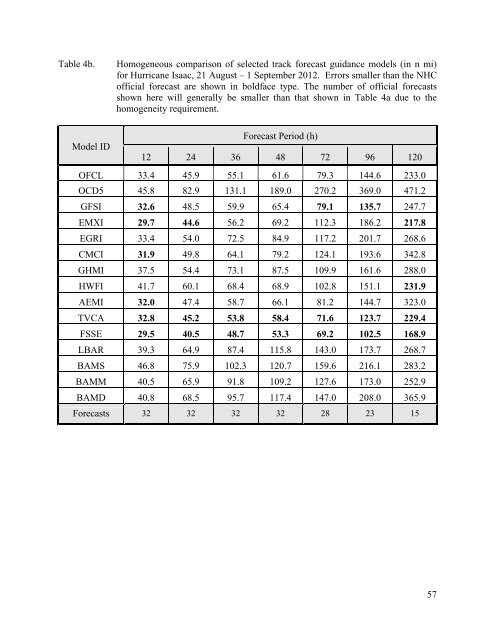
Table 4b. Homogeneous comparison of selected track forecast guidance models (in n mi)<br />
for <strong>Hurricane</strong> Isaac, 21 August – 1 September 2012. Errors smaller than the NHC<br />
official forecast are shown in boldface type. The number of official forecasts<br />
shown here will generally be smaller than that shown in Table 4a due to the<br />
homogeneity requirement.<br />
Model ID<br />
Forecast Period (h)<br />
12 24 36 48 72 96 120<br />
OFCL 33.4 45.9 55.1 61.6 79.3 144.6 233.0<br />
OCD5 45.8 82.9 131.1 189.0 270.2 369.0 471.2<br />
GFSI 32.6 48.5 59.9 65.4 79.1 135.7 247.7<br />
EMXI 29.7 44.6 56.2 69.2 112.3 186.2 217.8<br />
EGRI 33.4 54.0 72.5 84.9 117.2 201.7 268.6<br />
CMCI 31.9 49.8 64.1 79.2 124.1 193.6 342.8<br />
GHMI 37.5 54.4 73.1 87.5 109.9 161.6 288.0<br />
HWFI 41.7 60.1 68.4 68.9 102.8 151.1 231.9<br />
AEMI 32.0 47.4 58.7 66.1 81.2 144.7 323.0<br />
TVCA 32.8 45.2 53.8 58.4 71.6 123.7 229.4<br />
FSSE 29.5 40.5 48.7 53.3 69.2 102.5 168.9<br />
LBAR 39.3 64.9 87.4 115.8 143.0 173.7 268.7<br />
BAMS 46.8 75.9 102.3 120.7 159.6 216.1 283.2<br />
BAMM 40.5 65.9 91.8 109.2 127.6 173.0 252.9<br />
BAMD 40.8 68.5 95.7 117.4 147.0 208.0 365.9<br />
Forecasts 32 32 32 32 28 23 15<br />
57