Aktsiaselts Tallink Grupp - NASDAQ OMX Baltic
Aktsiaselts Tallink Grupp - NASDAQ OMX Baltic
Aktsiaselts Tallink Grupp - NASDAQ OMX Baltic

You also want an ePaper? Increase the reach of your titles
YUMPU automatically turns print PDFs into web optimized ePapers that Google loves.
Summary Financial Information<br />
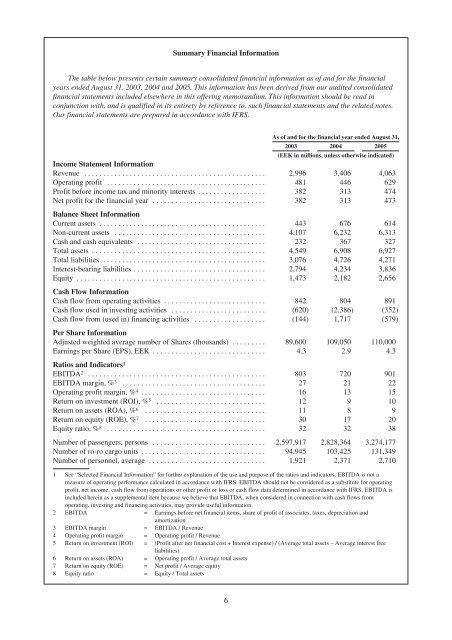
The table below presents certain summary consolidated financial information as of and for the financial<br />
years ended August 31, 2003, 2004 and 2005. This information has been derived from our audited consolidated<br />
financial statements included elsewhere in this offering memorandum. This information should be read in<br />
conjunction with, and is qualified in its entirety by reference to, such financial statements and the related notes.<br />
Our financial statements are prepared in accordance with IFRS.<br />
As of and for the financial year ended August 31,<br />
2003 2004 2005<br />
(EEK in millions, unless otherwise indicated)<br />
Income Statement Information<br />
Revenue ................................................ 2,996 3,406 4,063<br />
Operating profit .......................................... 481 446 629<br />
Profit before income tax and minority interests .................. 382 313 474<br />
Net profit for the financial year ..............................<br />
Balance Sheet Information<br />
382 313 473<br />
Currentassets ............................................ 443 676 614<br />
Non-current assets ........................................ 4,107 6,232 6,313<br />
Cash and cash equivalents .................................. 232 367 327<br />
Totalassets .............................................. 4,549 6,908 6,927<br />
Total liabilities ........................................... 3,076 4,726 4,271<br />
Interest-bearing liabilities ................................... 2,794 4,234 3,836<br />
Equity ..................................................<br />
Cash Flow Information<br />
1,473 2,182 2,656<br />
Cash flow from operating activities ........................... 842 804 891<br />
Cash flow used in investing activities ......................... (620) (2,386) (352)<br />
Cash flow from (used in) financing activities ...................<br />
Per Share Information<br />
(144) 1,717 (579)<br />
Adjusted weighted average number of Shares (thousands) ......... 89,600 109,050 110,000<br />
Earnings per Share (EPS), EEK ..............................<br />
Ratios and Indicators<br />
4.3 2.9 4.3<br />
1<br />
EBITDA2 ............................................... 803 720 901<br />
EBITDA margin, % 3 ...................................... 27 21 22<br />
Operating profit margin, % 4 ................................. 16 13 15<br />
Return on investment (ROI), % 5 ............................. 12 9 10<br />
Return on assets (ROA), % 6 ................................ 11 8 9<br />
Return on equity (ROE), % 7 ................................ 30 17 20<br />
Equity ratio, % 8 .......................................... 32 32 38<br />
Number of passengers, persons .............................. 2,597,917 2,828,364 3,274,177<br />
Number of ro-ro cargo units ................................. 94,945 103,425 131,349<br />
Number of personnel, average ............................... 1,921 2,371 2,710<br />
1 See “Selected Financial Information” for further explanation of the use and purpose of the ratios and indicators. EBITDA is not a<br />
measure of operating performance calculated in accordance with IFRS. EBITDA should not be considered as a substitute for operating<br />
profit, net income, cash flow from operations or other profit or loss or cash flow data determined in accordance with IFRS. EBITDA is<br />
included herein as a supplemental item because we believe that EBITDA, when considered in connection with cash flows from<br />
operating, investing and financing activities, may provide useful information.<br />
2 EBITDA = Earnings before net financial items, share of profit of associates, taxes, depreciation and<br />
amortization<br />
3 EBITDA margin = EBITDA / Revenue<br />
4 Operating profit margin = Operating profit / Revenue<br />
5 Return on investment (ROI) = (Profit after net financial cost + Interest expense) / (Average total assets – Average interest free<br />
liabilities)<br />
6 Return on assets (ROA) = Operating profit / Average total assets<br />
7 Return on equity (ROE) = Net profit / Average equity<br />
8 Equity ratio = Equity / Total assets<br />
6