Aktsiaselts Tallink Grupp - NASDAQ OMX Baltic
Aktsiaselts Tallink Grupp - NASDAQ OMX Baltic
Aktsiaselts Tallink Grupp - NASDAQ OMX Baltic

Create successful ePaper yourself
Turn your PDF publications into a flip-book with our unique Google optimized e-Paper software.
into the following principal components: cost of goods sold (representing 24 percent of our total cost base in the<br />
financial year ended August 31, 2005), port charges (15 percent), fuel costs (11 percent) and onboard staff costs<br />
(11 percent). In 2004, the cost of inventory increased and margins decreased as a result of Estonia’s accession to<br />
the European Union and the consequent removal of tax-free shop sales on the Helsinki—Tallinn route. Our<br />
onboard price levels currently follow the price development in onshore shops in Estonia. Our fuel costs are<br />
subject to volatility in oil prices, despite the fact that we purchase our fuel tax-free in Estonia. We currently pass<br />
a portion of the recent increase in oil price on to our customers through a specific fuel surcharge. Furthermore,<br />
our high-speed ro-pax ferries ordered in August 2005 will be more fuel efficient than our existing high-speed<br />
ferries.<br />
We generally benefit from lower Estonian salary levels compared to, for example, Finland or Sweden. In<br />
August 2005, we renewed our agreement with the Estonian Seamen’s Independent Union concerning salary<br />
increases for onboard staff for another three years. Pursuant to the agreement the annual employee salary<br />
increase is five percent. See “Business—Employees and Labor Relations.”<br />
As regards financial expenses, we incur significant interest costs associated with the financing of our<br />
vessels. Approximately 92 percent of our outstanding indebtedness is issued at floating rates and, accordingly,<br />
our results are affected by changes in interest rates payable under the loan agreements.<br />
Seasonality. Passenger traffic on our routes is seasonal, with peaks in passenger numbers typically in the<br />
summer months of June, July and August. Furthermore, our high-speed ferries are out of service during parts of<br />
the winter season, although we will be able to operate the new high-speed ro-pax ferries throughout the winter<br />
season starting from late 2007. As a result of the seasonal nature of our operations, our profitability and cash<br />
flows also fluctuate on a seasonal and, thus, quarterly basis.<br />
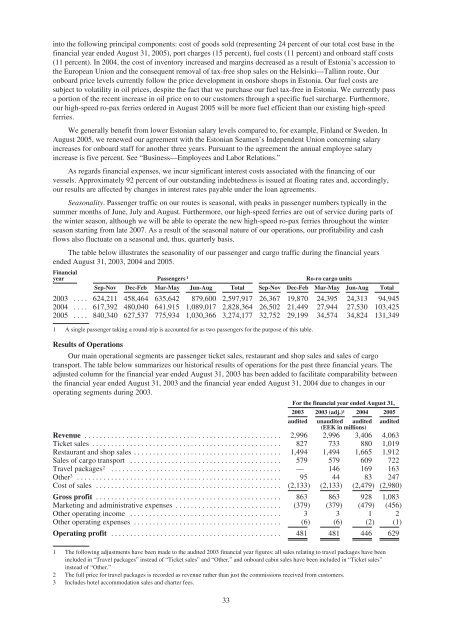
The table below illustrates the seasonality of our passenger and cargo traffic during the financial years<br />
ended August 31, 2003, 2004 and 2005.<br />
Financial<br />
year Passengers 1 Ro-ro cargo units<br />
Sep-Nov Dec-Feb Mar-May Jun-Aug Total Sep-Nov Dec-Feb Mar-May Jun-Aug Total<br />
2003 .... 624,211 458,464 635,642 879,600 2,597,917 26,367 19,870 24,395 24,313 94,945<br />
2004 .... 617,392 480,040 641,915 1,089,017 2,828,364 26,502 21,449 27,944 27,530 103,425<br />
2005 .... 840,340 627,537 775,934 1,030,366 3,274,177 32,752 29,199 34,574 34,824 131,349<br />
1 A single passenger taking a round-trip is accounted for as two passengers for the purpose of this table.<br />
Results of Operations<br />
Our main operational segments are passenger ticket sales, restaurant and shop sales and sales of cargo<br />
transport. The table below summarizes our historical results of operations for the past three financial years. The<br />
adjusted column for the financial year ended August 31, 2003 has been added to facilitate comparability between<br />
the financial year ended August 31, 2003 and the financial year ended August 31, 2004 due to changes in our<br />
operating segments during 2003.<br />
For the financial year ended August 31,<br />
2003 2003 (adj.) 1 2004 2005<br />
audited unaudited audited audited<br />
(EEK in millions)<br />
Revenue .................................................... 2,996 2,996 3,406 4,063<br />
Ticket sales .................................................. 827 733 880 1,019<br />
Restaurantandshopsales ....................................... 1,494 1,494 1,665 1,912<br />
Salesofcargotransport ........................................ 579 579 609 722<br />
Travel packages2 ............................................. — 146 169 163<br />
Other3 ...................................................... 95 44 83 247<br />
Costofsales ................................................. (2,133) (2,133) (2,479) (2,980)<br />
Gross profit ................................................. 863 863 928 1,083<br />
Marketing and administrative expenses ............................ (379) (379) (479) (456)<br />
Other operating income ........................................ 3 3 1 2<br />
Other operating expenses ....................................... (6) (6) (2) (1)<br />
Operating profit ............................................. 481 481 446 629<br />
1 The following adjustments have been made to the audited 2003 financial year figures: all sales relating to travel packages have been<br />
included in “Travel packages” instead of “Ticket sales” and “Other,” and onboard cabin sales have been included in “Ticket sales”<br />
instead of “Other.”<br />
2 The full price for travel packages is recorded as revenue rather than just the commissions received from customers.<br />
3 Includes hotel accommodation sales and charter fees.<br />
33