Aktsiaselts Tallink Grupp - NASDAQ OMX Baltic
Aktsiaselts Tallink Grupp - NASDAQ OMX Baltic
Aktsiaselts Tallink Grupp - NASDAQ OMX Baltic

You also want an ePaper? Increase the reach of your titles
YUMPU automatically turns print PDFs into web optimized ePapers that Google loves.
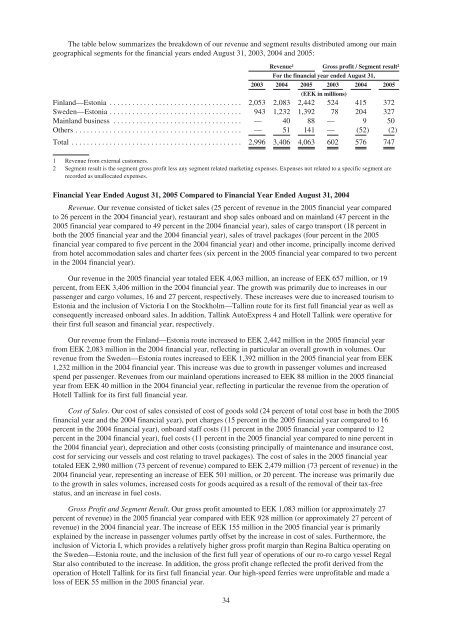
The table below summarizes the breakdown of our revenue and segment results distributed among our main<br />
geographical segments for the financial years ended August 31, 2003, 2004 and 2005:<br />
Revenue1 Gross profit / Segment result2 For the financial year ended August 31,<br />
2003 2004 2005 2003 2004 2005<br />
(EEK in millions)<br />
Finland—Estonia ................................... 2,0532,0832,442524 415 372<br />
Sweden—Estonia ................................... 943 1,2321,392 78 204 327<br />
Mainlandbusiness .................................. — 40 88 — 9 50<br />
Others............................................ — 51 141 — (52) (2)<br />
Total ............................................. 2,9963,4064,063602 576 747<br />
1 Revenue from external customers.<br />
2 Segment result is the segment gross profit less any segment related marketing expenses. Expenses not related to a specific segment are<br />
recorded as unallocated expenses.<br />
Financial Year Ended August 31, 2005 Compared to Financial Year Ended August 31, 2004<br />
Revenue. Our revenue consisted of ticket sales (25 percent of revenue in the 2005 financial year compared<br />
to 26 percent in the 2004 financial year), restaurant and shop sales onboard and on mainland (47 percent in the<br />
2005 financial year compared to 49 percent in the 2004 financial year), sales of cargo transport (18 percent in<br />
both the 2005 financial year and the 2004 financial year), sales of travel packages (four percent in the 2005<br />
financial year compared to five percent in the 2004 financial year) and other income, principally income derived<br />
from hotel accommodation sales and charter fees (six percent in the 2005 financial year compared to two percent<br />
in the 2004 financial year).<br />
Our revenue in the 2005 financial year totaled EEK 4,063 million, an increase of EEK 657 million, or 19<br />
percent, from EEK 3,406 million in the 2004 financial year. The growth was primarily due to increases in our<br />
passenger and cargo volumes, 16 and 27 percent, respectively. These increases were due to increased tourism to<br />
Estonia and the inclusion of Victoria I on the Stockholm—Tallinn route for its first full financial year as well as<br />
consequently increased onboard sales. In addition, <strong>Tallink</strong> AutoExpress 4 and Hotell <strong>Tallink</strong> were operative for<br />
their first full season and financial year, respectively.<br />
Our revenue from the Finland—Estonia route increased to EEK 2,442 million in the 2005 financial year<br />
from EEK 2,083 million in the 2004 financial year, reflecting in particular an overall growth in volumes. Our<br />
revenue from the Sweden—Estonia routes increased to EEK 1,392 million in the 2005 financial year from EEK<br />
1,232 million in the 2004 financial year. This increase was due to growth in passenger volumes and increased<br />
spend per passenger. Revenues from our mainland operations increased to EEK 88 million in the 2005 financial<br />
year from EEK 40 million in the 2004 financial year, reflecting in particular the revenue from the operation of<br />
Hotell <strong>Tallink</strong> for its first full financial year.<br />
Cost of Sales. Our cost of sales consisted of cost of goods sold (24 percent of total cost base in both the 2005<br />
financial year and the 2004 financial year), port charges (15 percent in the 2005 financial year compared to 16<br />
percent in the 2004 financial year), onboard staff costs (11 percent in the 2005 financial year compared to 12<br />
percent in the 2004 financial year), fuel costs (11 percent in the 2005 financial year compared to nine percent in<br />
the 2004 financial year), depreciation and other costs (consisting principally of maintenance and insurance cost,<br />
cost for servicing our vessels and cost relating to travel packages). The cost of sales in the 2005 financial year<br />
totaled EEK 2,980 million (73 percent of revenue) compared to EEK 2,479 million (73 percent of revenue) in the<br />
2004 financial year, representing an increase of EEK 501 million, or 20 percent. The increase was primarily due<br />
to the growth in sales volumes, increased costs for goods acquired as a result of the removal of their tax-free<br />
status, and an increase in fuel costs.<br />
Gross Profit and Segment Result. Our gross profit amounted to EEK 1,083 million (or approximately 27<br />
percent of revenue) in the 2005 financial year compared with EEK 928 million (or approximately 27 percent of<br />
revenue) in the 2004 financial year. The increase of EEK 155 million in the 2005 financial year is primarily<br />
explained by the increase in passenger volumes partly offset by the increase in cost of sales. Furthermore, the<br />
inclusion of Victoria I, which provides a relatively higher gross profit margin than Regina <strong>Baltic</strong>a operating on<br />
the Sweden—Estonia route, and the inclusion of the first full year of operations of our ro-ro cargo vessel Regal<br />
Star also contributed to the increase. In addition, the gross profit change reflected the profit derived from the<br />
operation of Hotell <strong>Tallink</strong> for its first full financial year. Our high-speed ferries were unprofitable and made a<br />
loss of EEK 55 million in the 2005 financial year.<br />
34