Production of Polysilicon using a Modified Siemens Process
Production of Polysilicon using a Modified Siemens Process
Production of Polysilicon using a Modified Siemens Process

You also want an ePaper? Increase the reach of your titles
YUMPU automatically turns print PDFs into web optimized ePapers that Google loves.
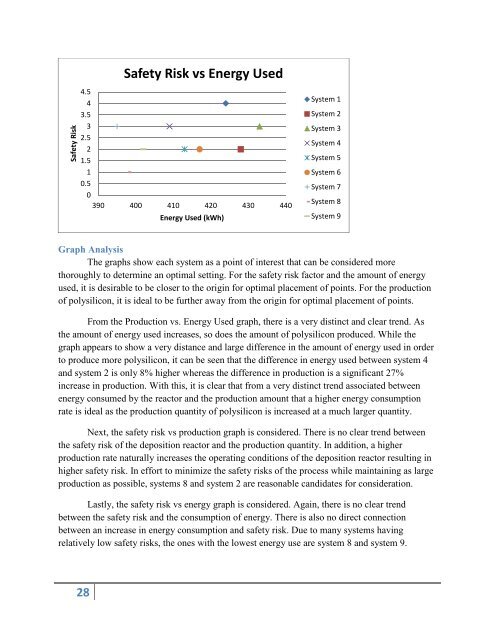
Graph Analysis<br />
The graphs show each system as a point <strong>of</strong> interest that can be considered more<br />
thoroughly to determine an optimal setting. For the safety risk factor and the amount <strong>of</strong> energy<br />
used, it is desirable to be closer to the origin for optimal placement <strong>of</strong> points. For the production<br />
<strong>of</strong> polysilicon, it is ideal to be further away from the origin for optimal placement <strong>of</strong> points.<br />
From the <strong>Production</strong> vs. Energy Used graph, there is a very distinct and clear trend. As<br />
the amount <strong>of</strong> energy used increases, so does the amount <strong>of</strong> polysilicon produced. While the<br />
graph appears to show a very distance and large difference in the amount <strong>of</strong> energy used in order<br />
to produce more polysilicon, it can be seen that the difference in energy used between system 4<br />
and system 2 is only 8% higher whereas the difference in production is a significant 27%<br />
increase in production. With this, it is clear that from a very distinct trend associated between<br />
energy consumed by the reactor and the production amount that a higher energy consumption<br />
rate is ideal as the production quantity <strong>of</strong> polysilicon is increased at a much larger quantity.<br />
Next, the safety risk vs production graph is considered. There is no clear trend between<br />
the safety risk <strong>of</strong> the deposition reactor and the production quantity. In addition, a higher<br />
production rate naturally increases the operating conditions <strong>of</strong> the deposition reactor resulting in<br />
higher safety risk. In effort to minimize the safety risks <strong>of</strong> the process while maintaining as large<br />
production as possible, systems 8 and system 2 are reasonable candidates for consideration.<br />
Lastly, the safety risk vs energy graph is considered. Again, there is no clear trend<br />
between the safety risk and the consumption <strong>of</strong> energy. There is also no direct connection<br />
between an increase in energy consumption and safety risk. Due to many systems having<br />
relatively low safety risks, the ones with the lowest energy use are system 8 and system 9.