Annual Report 2012.pdf - Cherry
Annual Report 2012.pdf - Cherry
Annual Report 2012.pdf - Cherry

You also want an ePaper? Increase the reach of your titles
YUMPU automatically turns print PDFs into web optimized ePapers that Google loves.
Part 2 group<br />
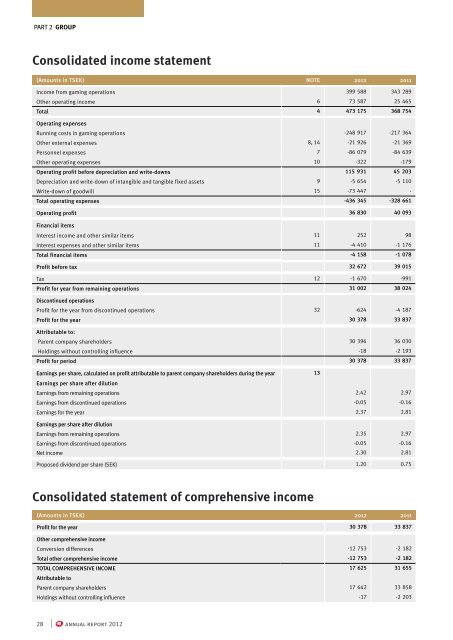
Consolidated income statement<br />
(Amounts in TSEK) NOTE 2012 2011<br />
Income from gaming operations 399 588 343 289<br />
Other operating income 6 73 587 25 465<br />
Total 4 473 175 368 754<br />
Operating expenses<br />
Running costs in gaming operations -248 917 -217 364<br />
Other external expenses 8, 14 -21 926 -21 369<br />
Personnel expenses 7 -86 079 -84 639<br />
Other operating expenses 10 -322 -179<br />
Operating profit before depreciation and write-downs 115 931 45 203<br />
Depreciation and write-down of intangible and tangible fixed assets 9 -5 654 -5 110<br />
Write-down of goodwill 15 -73 447 -<br />
Total operating expenses -436 345 -328 661<br />
Operating profit 36 830 40 093<br />
Financial items<br />
Interest income and other similar items 11 252 98<br />
Interest expenses and other similar items 11 -4 410 -1 176<br />
Total financial items -4 158 -1 078<br />
Profit before tax 32 672 39 015<br />
Tax 12 -1 670 -991<br />
Profit for year from remaining operations 31 002 38 024<br />
Discontinued operations<br />
Profit for the year from discontinued operations 32 -624 -4 187<br />
Profit for the year 30 378 33 837<br />
Attributable to:<br />
Parent company shareholders 30 396 36 030<br />
Holdings without controlling influence -18 -2 193<br />
Profit for period 30 378 33 837<br />
Earnings per share, calculated on profit attributable to parent company shareholders during the year<br />
Earnings per share after dilution<br />
13<br />
Earnings from remaining operations 2.42 2.97<br />
Earnings from discontinued operations -0.05 -0.16<br />
Earnings for the year 2.37 2.81<br />
Earnings per share after dilution<br />
Earnings from remaining operations 2.35 2.97<br />
Earnings from discontinued operations -0.05 -0.16<br />
Net income 2.30 2.81<br />
Proposed dividend per share (SEK) 1.20 0.75<br />
Consolidated statement of comprehensive income<br />
(Amounts in TSEK) 2012 2011<br />
Profit for the year 30 378 33 837<br />
Other comprehensive income<br />
Conversion differences -12 753 -2 182<br />
Total other comprehensive income -12 753 -2 182<br />
TOTAL COMPREHENSIVE INCOME<br />
Attributable to<br />
17 625 31 655<br />
Parent company shareholders 17 642 33 858<br />
Holdings without controlling influence -17 -2 203<br />
28 | annual report 2012