Annual Report 2012.pdf - Cherry
Annual Report 2012.pdf - Cherry
Annual Report 2012.pdf - Cherry
Create successful ePaper yourself
Turn your PDF publications into a flip-book with our unique Google optimized e-Paper software.
Part 2 definitions<br />
Definitions<br />
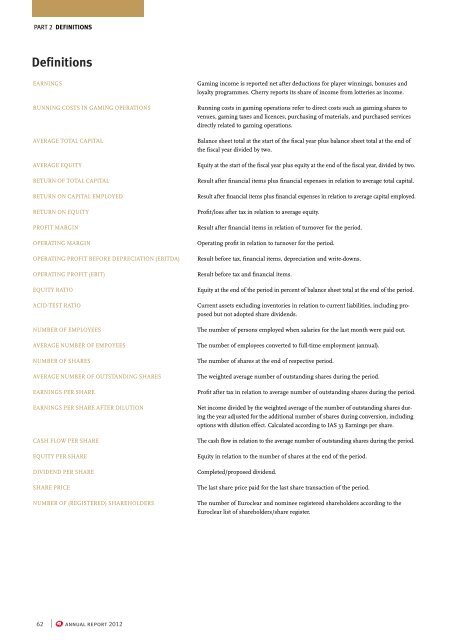
EARNINGS Gaming income is reported net after deductions for player winnings, bonuses and<br />
loyalty programmes. <strong>Cherry</strong> reports its share of income from lotteries as income.<br />
RUNNING COSTS IN GAMING OPERATIONS Running costs in gaming operations refer to direct costs such as gaming shares to<br />
venues, gaming taxes and licences, purchasing of materials, and purchased services<br />
directly related to gaming operations.<br />
AVERAGE TOTAL CAPITAL Balance sheet total at the start of the fiscal year plus balance sheet total at the end of<br />
the fiscal year divided by two.<br />
AVERAGE EQUITY Equity at the start of the fiscal year plus equity at the end of the fiscal year, divided by two.<br />
RETURN OF TOTAL CAPITAL Result after financial items plus financial expenses in relation to average total capital.<br />
RETURN ON CAPITAL EMPLOYED Result after financial items plus financial expenses in relation to average capital employed.<br />
RETURN ON EQUITY Profit/loss after tax in relation to average equity.<br />
PROFIT MARGIN Result after financial items in relation of turnover for the period.<br />
OPERATING MARGIN Operating profit in relation to turnover for the period.<br />
OPERATING PROFIT BEFORE DEPRECIATION (EBITDA) Result before tax, financial items, depreciation and write-downs.<br />
OPERATING PROFIT (EBIT) Result before tax and financial items.<br />
EQUITY RATIO Equity at the end of the period in percent of balance sheet total at the end of the period.<br />
ACID-TEST RATIO Current assets excluding inventories in relation to current liabilities, including proposed<br />
but not adopted share dividends.<br />
NUMBER OF EMPLOYEES The number of persons employed when salaries for the last month were paid out.<br />
AVERAGE NUMBER OF EMPOYEES The number of employees converted to full-time employment (annual).<br />
NUMBER OF SHARES The number of shares at the end of respective period.<br />
AVERAGE NUMBER OF OUTSTANDING SHARES The weighted average number of outstanding shares during the period.<br />
EARNINGS PER SHARE Profit after tax in relation to average number of outstanding shares during the period.<br />
EARNINGS PER SHARE AFTER DILUTION Net income divided by the weighted average of the number of outstanding shares during<br />
the year adjusted for the additional number of shares during conversion, including<br />
options with dilution effect. Calculated according to IAS 33 Earnings per share.<br />
CASH FLOW PER SHARE The cash flow in relation to the average number of outstanding shares during the period.<br />
EQUITY PER SHARE Equity in relation to the number of shares at the end of the period.<br />
DIVIDEND PER SHARE Completed/proposed dividend.<br />
SHARE PRICE The last share price paid for the last share transaction of the period.<br />
NUMBER OF (REGISTERED) SHAREHOLDERS The number of Euroclear and nominee registered shareholders according to the<br />
Euroclear list of shareholders/share register.<br />
62 | annual report 2012


