Annual Report 2012.pdf - Cherry
Annual Report 2012.pdf - Cherry
Annual Report 2012.pdf - Cherry
Create successful ePaper yourself
Turn your PDF publications into a flip-book with our unique Google optimized e-Paper software.
Part 2 notes<br />
50 | annual report 2012<br />
Group Parent Company<br />
Taxes in balance sheets 2012 2011 2012 2011<br />
Deferred tax receivables<br />
- Deferred tax receivables, temporary differences 17 157 - -<br />
Total Long-term receivables 17 157 0 0<br />
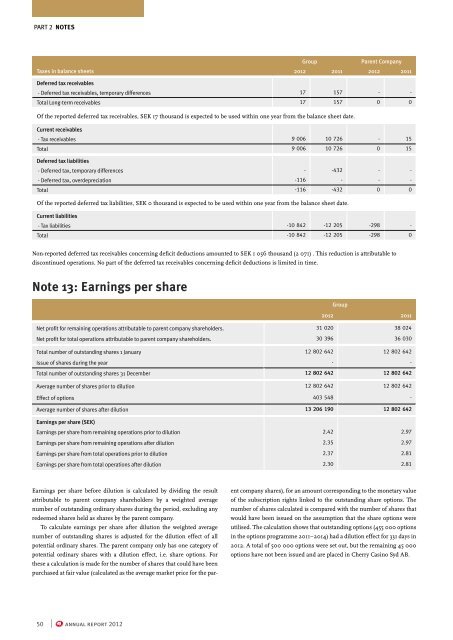
Of the reported deferred tax receivables, SEK 17 thousand is expected to be used within one year from the balance sheet date.<br />
Current receivables<br />
- Tax receivables 9 006 10 726 - 15<br />
Total 9 006 10 726 0 15<br />
Deferred tax liabilities<br />
- Deferred tax, temporary differences - -432 - -<br />
- Deferred tax, overdepreciation -116 - - -<br />
Total -116 -432 0 0<br />
Of the reported deferred tax liabilities, SEK 0 thousand is expected to be used within one year from the balance sheet date.<br />
Current liabilities<br />
- Tax liabilities -10 842 -12 205 -298 -<br />
Total -10 842 -12 205 -298 0<br />
Non-reported deferred tax receivables concerning deficit deductions amounted to SEK 1 056 thousand (2 071) . This reduction is attributable to<br />
discontinued operations. No part of the deferred tax receivables concerning deficit deductions is limited in time.<br />
Note 13: Earnings per share<br />
Earnings per share before dilution is calculated by dividing the result<br />
attributable to parent company shareholders by a weighted average<br />
number of outstanding ordinary shares during the period, excluding any<br />
redeemed shares held as shares by the parent company.<br />
To calculate earnings per share after dilution the weighted average<br />
number of outstanding shares is adjusted for the dilution effect of all<br />
potential ordinary shares. The parent company only has one category of<br />
potential ordinary shares with a dilution effect, i.e. share options. For<br />
these a calculation is made for the number of shares that could have been<br />
purchased at fair value (calculated as the average market price for the par-<br />
Group<br />
2012 2011<br />
Net profit for remaining operations attributable to parent company shareholders. 31 020 38 024<br />
Net profit for total operations attributable to parent company shareholders. 30 396 36 030<br />
Total number of outstanding shares 1 January 12 802 642 12 802 642<br />
Issue of shares during the year - -<br />
Total number of outstanding shares 31 December 12 802 642 12 802 642<br />
Average number of shares prior to dilution 12 802 642 12 802 642<br />
Effect of options 403 548 -<br />
Average number of shares after dilution 13 206 190 12 802 642<br />
Earnings per share (SEK)<br />
Earnings per share from remaining operations prior to dilution 2.42 2.97<br />
Earnings per share from remaining operations after dilution 2.35 2.97<br />
Earnings per share from total operations prior to dilution 2.37 2.81<br />
Earnings per share from total operations after dilution 2.30 2.81<br />
ent company shares), for an amount corresponding to the monetary value<br />
of the subscription rights linked to the outstanding share options. The<br />
number of shares calculated is compared with the number of shares that<br />
would have been issued on the assumption that the share options were<br />
utilised. The calculation shows that outstanding options (455 000 options<br />
in the options programme 2011–2014) had a dilution effect for 331 days in<br />
2012. A total of 500 000 options were set out, but the remaining 45 000<br />
options have not been issued and are placed in <strong>Cherry</strong> Casino Syd AB.


