Download the publication - Tropenbos International
Download the publication - Tropenbos International
Download the publication - Tropenbos International

Create successful ePaper yourself
Turn your PDF publications into a flip-book with our unique Google optimized e-Paper software.
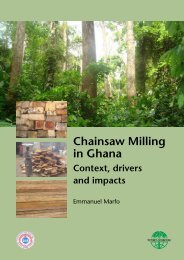
Plant diversity in a Central African rain forest: Implications for biodiversity conservation in Cameroon<br />
Data analysis<br />
The analysis focussed on family and species level floristic richness and diversity of<br />
<strong>the</strong> various life forms and forest strata within 145 plots recorded in <strong>the</strong> area.<br />
Although 11 vegetation types were identified for <strong>the</strong> Campo-Ma’an area (Chapter<br />
2), <strong>the</strong> analysis was done on 6 main vegetation types by grouping some of <strong>the</strong> forest<br />
types for a better illustration of <strong>the</strong> diversity patterns. All coastal forest types were<br />
grouped as coastal forest, all Caesalpinioideae forests as forest rich in<br />
Caesalpinioideae, <strong>the</strong> Calpocalyx and Sacoglottis forests as forest rich in Calpocalyx<br />
heitzii and Sacoglottis gabonensis, and <strong>the</strong> mixed forests as mixed evergreen and<br />
semi-deciduous forest. The 2 plots recorded in mangroves were excluded from <strong>the</strong><br />
analysis because mangroves form a mono-dominant community with only 4 species.<br />
In this study tree layer comprised all vascular plant species with DBH ≥ 10 cm,<br />
shrub layer (1.5 cm ≤ DBH < 10 cm) and herbaceous layer (1 cm ≤ DBH < 1.5 cm).<br />
Diversity was measured by recording <strong>the</strong> number of species (species richness) and<br />
<strong>the</strong>ir relative abundance in <strong>the</strong> different plots and vegetation types. This study<br />
focused on <strong>the</strong> α diversity (species richness), which is defined as <strong>the</strong> number of<br />
species within a chosen area, given equal weight on each species, and <strong>the</strong> β<br />
diversity, which is <strong>the</strong> difference in species diversity between areas or communities<br />
(Kent & Coker, 1992; Bisby, 1995). β diversity was quantified with <strong>the</strong> Shannon<br />
diversity index (H’) using all individuals above 1 cm DBH and all species per plot.<br />
Phytosociological parameters (relative density and relative frequency) and Shannon<br />
diversity index were calculated following Whittaker (1975), Kent & Coker (1992)<br />
and Magurran (1988). The SPSS package version 10.0 for Windows was used for<br />
statistical analyses. The Pearson’s correlation test was used to correlate <strong>the</strong> species<br />
richness and diversity between <strong>the</strong> various growth forms and forest layers. We<br />
compared <strong>the</strong> diversity and species richness within forest layers and within growth<br />
forms using a General Linear Model (GLM) followed by a Tukey Multiple<br />
Comparison test (P < 0.05).<br />
3.3. RESULTS<br />
General patterns of species richness and diversity within forest types<br />
A total of 76360 trees, shrubs, climbers and o<strong>the</strong>r vascular plants with DBH ≥ 1 cm<br />
was recorded in 145 plots of 0.1 ha each in <strong>the</strong> various vegetation types. They<br />
belonged to 1112 species, 420 genera and 97 families. In addition, 759 species of<br />
vascular plants (herbs, hemi-epiphytes, shrubs and seedlings of tree species)<br />
belonging to 101 families and 327 genera were recorded in <strong>the</strong> subplots of 5 m x 5<br />
m each located within <strong>the</strong> 0.1 ha plots. Overall, 1471 species of vascular plants,<br />
including ferns and fern allies belonging to 542 genera and 126 families were<br />
recorded. More than 73% of all specimens collected were identified at species level,<br />
23% at generic level, 3% at family level and 1% unidentified. As shown in Table<br />
3.1, <strong>the</strong> number of stems/ha for all vascular plants ≥ 1 cm DBH varied from 5798 in<br />
swamps to 6912 in <strong>the</strong> submontane forest. The number of species/ha for all vascular<br />
plants ≥ 1 cm recorded varied from 293 in swamps to 468 in <strong>the</strong> lowland evergreen<br />
forest rich in Caesalpinioideae. The Shannon diversity (H’) varied from 4.73 in<br />
coastal forests to 5.16 in forests rich in Caesalpinioideae. More than 57% of <strong>the</strong><br />
plots have above 100 species/0.1 ha and a Shannon diversity (H’) > 4 with <strong>the</strong> most<br />
44