Download the publication - Tropenbos International
Download the publication - Tropenbos International
Download the publication - Tropenbos International

Create successful ePaper yourself
Turn your PDF publications into a flip-book with our unique Google optimized e-Paper software.
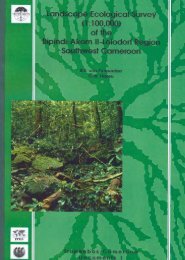
Plant diversity in a Central African rain forest: Implications for biodiversity conservation in Cameroon<br />
Table 3.5 Summary of <strong>the</strong> number of species of <strong>the</strong> various growth forms recorded in 136 vegetative<br />
subplots of 5 m x 5 m each covering 0.34 ha.<br />
Forest types<br />
Floristic composition<br />
50<br />
Coastal<br />
Forest<br />
Swamps<br />
Forest rich in<br />
Caesalpinioideae<br />
Forest rich in<br />
Calpocalyx and<br />
Sacoglottis<br />
Mixed evergreen Submontane<br />
and semi-deciduous<br />
forest<br />
forest<br />
Trees<br />
27 6 35 38<br />
37 26<br />
Shrubs/small trees 87 14 148 102 134 74<br />
Herbs 88 14 142 98 105 77<br />
Lianas 30 3 36 33 32 11<br />
Total No of species 232 37 368 271 308 188<br />
Total No of families 67 27 76 63 68 47<br />
Table 3.6 Pearson correlation coefficients between <strong>the</strong> Shannon diversity (H’) of <strong>the</strong> various growth<br />
forms recorded for all vascular plants with DBH ≥ 1 cm in 145 plots of 0.1 ha each.<br />
Life forms Large trees Shrubs/small<br />
trees<br />
Herbs Lianas<br />
Large trees 1<br />
Shrubs/small trees 0.47** 1<br />
Herbs 0.46** 0.29** 1<br />
Lianas 0.003 0.20* 0.19* 1<br />
Pearson correlation is significant for * P < 0.05 and ** P < 0.01<br />
<strong>the</strong> number of herbaceous species (Table 3.5), moving from 25 species (in 145 plots<br />
of 0.1 ha each) to 257 species (in 136 subplots of 25 m² each covering 0.34<br />
ha).Trees and shrubs were <strong>the</strong> most diverse growth forms followed by lianas and<br />
herbaceous species respectively (Table 3.4). The Shannon diversity (H’) of trees<br />
varied from 3.96 (swamps) to 4.67 (submontane forest), for shrubs from 3.32<br />
(coastal forests) to 4.66 (submontane forest) and for herbaceous species from 0.53<br />
(coastal forests) to 1.03 (forest rich in Calpocalyx and Sacoglottis).<br />
There was a significant positive correlation between <strong>the</strong> number of large and<br />
medium sized tree species and that of shrubs/small trees (F1, 143 = 112.033, R² =<br />
0.439, P < 0.001) and woody climbers (F1, 143 = 26. 986, R² = 0.159, P < 0.001).<br />
There was also a significant positive correlation between <strong>the</strong> diversity of large and<br />
medium sized trees and that of <strong>the</strong> shrubs/small trees and woody climbers (Figures<br />
3.3 & 3.4). The correlations between <strong>the</strong> diversity/species richness of large and<br />
medium sized trees and that of <strong>the</strong> herbaceous species were not significant (F1, 143 =<br />
0.001, R² = 0.00002, P = 0.975 for Shannon diversity and F1, 143 = 0.0387, R² =<br />
0.0003, P = 0.844 for species richness). The Shannon diversity (H’) was<br />
significantly different among <strong>the</strong> various growth forms (F3, 34.6 = 151.290, P < 0.001)<br />
when correcting for differences in vegetation types (GLM: F10, 30 = 2.727, P < 0.01<br />
for vegetation type included as a random factor). A Tukey multiple comparison test<br />
showed that all growth forms were significantly different from each o<strong>the</strong>r (P < 0.05)<br />
with trees having <strong>the</strong> highest mean value (H’ = 3.37) and <strong>the</strong> lowest (H’ = 0.24) for<br />
<strong>the</strong> herbaceous species.