Download the publication - Tropenbos International
Download the publication - Tropenbos International
Download the publication - Tropenbos International

You also want an ePaper? Increase the reach of your titles
YUMPU automatically turns print PDFs into web optimized ePapers that Google loves.
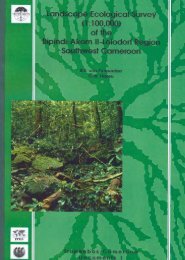
Plant diversity in a Central African rain forest: Implications for biodiversity conservation in Cameroon<br />
Table 4.2 Contribution of selected bio-indicator species in <strong>the</strong> Campo-Ma’an area<br />
Strict and<br />
Nor<strong>the</strong>rn Total No of<br />
narrow Begonia Caesalps Rinorea Rubiaceae limit of bio-indicator %<br />
Area<br />
endemic<br />
distribution species<br />
Campo-Ma’an National Park 39 10 26 11 51 16 153 77<br />
Kribi-Campo-Mvini area 33 7 25 10 46 11 132 66<br />
Nyabissan-Ma’an-Mekok area 9 4 18 9 29 23 92 46<br />
Campo-Ma’an area 58 13 32 13 59 24 199*<br />
*Note that <strong>the</strong> total number of bio-indicator species in this table (199) is higher than <strong>the</strong> total number of<br />
species listed in Table 4.1 (178) because some species occur in more than one group. The Kribi-Campo-<br />
Mvini area is located in <strong>the</strong> western part of <strong>the</strong> Campo-Ma’an area while <strong>the</strong> Nyabissan-Ma’an-Mekok<br />
area is situated in <strong>the</strong> south-eastern part.<br />
Several maps were produced to display <strong>the</strong> distribution patterns of bio-indicator<br />
species within <strong>the</strong>ir respective groups (Figures 4.2 to 4.8). Overall, <strong>the</strong>re was a high<br />
concentration of bio-indicator species in <strong>the</strong> Park and <strong>the</strong> Kribi-Campo-Mvini area<br />
and a relatively low concentration of <strong>the</strong>se species in <strong>the</strong> Nyabissan-Ma’an-Mekok<br />
area (Table 4.2 & Figure 4.7). A similar pattern was observed for <strong>the</strong> distribution of<br />
strict and narrow endemic species (Figure 4.2). The lowland evergreen forest rich in<br />
Caesalpinioideae and <strong>the</strong> submontane forest located in <strong>the</strong> National Park and in <strong>the</strong><br />
western part of <strong>the</strong> Campo-Ma’an area were rich in bio-indicators species, while <strong>the</strong><br />
mixed evergreen and semi-deciduous forest was characterised by a low<br />
concentration of <strong>the</strong>se species (Figures 4.1 & 4.8). The distribution of Begonia<br />
showed that some species were often found in mountainous areas between<br />
Ebianemeyong and Akom II, or along slopes near hilltops in <strong>the</strong> lowland forest, and<br />
o<strong>the</strong>rs were located along small streams in <strong>the</strong> lowland forest. Surprisingly, many of<br />
<strong>the</strong>se Begonias were not recorded in <strong>the</strong> mixed evergreen and semi-deciduous forest<br />
in <strong>the</strong> Ma’an area. As for <strong>the</strong> Caesalps, <strong>the</strong>ir distribution showed a high<br />
concentration of species in <strong>the</strong> park and in <strong>the</strong> Kribi-Campo-Mvini area (Figure 4.4).<br />
There was also a decrease in <strong>the</strong> number of Caesalps in <strong>the</strong> coastal forest rich in<br />
Sacoglottis gabonensis (Campo area) and in <strong>the</strong> mixed evergreen and semideciduous<br />
forest with a predominance of semi-deciduous elements (Ma’an area). In<br />
Rinorea, many indicator species were mostly confined to <strong>the</strong> lowland forest,<br />
particularly in <strong>the</strong> evergreen forest rich in Caesalpinioideae (Figure 4.5). There was<br />
a decrease in <strong>the</strong> number of <strong>the</strong>se species with increasing altitude and some of <strong>the</strong>m<br />
were most frequent in <strong>the</strong> coastal forest. There was a relatively even distribution of<br />
bio-indicator species from <strong>the</strong> Rubiaceae family within <strong>the</strong> Campo-Ma’an area<br />
although <strong>the</strong> Ma’an area showed a relatively low concentration of <strong>the</strong>se species<br />
(Figure 4.6). As for species that reach <strong>the</strong> nor<strong>the</strong>rn limit of <strong>the</strong>ir distribution in <strong>the</strong><br />
Campo-Ma’an area, <strong>the</strong>re was a decrease in numbers from <strong>the</strong> border with<br />
Equatorial Guinea to <strong>the</strong> Kribi–Akom II area fur<strong>the</strong>r north (Figure 4.7). Some<br />
species such as Aucoumea klaineana, Dacryodes buettneri, Deinbollia pycnophylla<br />
and Testulea gabonensis were limited to <strong>the</strong> sou<strong>the</strong>rn part of Campo-Ma’an in <strong>the</strong><br />
Ma’an area, to <strong>the</strong> Dipikar island and around Ebianemeyong and Mvini.<br />
68