Farming in the Uplands - ARCHIVE: Defra
Farming in the Uplands - ARCHIVE: Defra
Farming in the Uplands - ARCHIVE: Defra

Create successful ePaper yourself
Turn your PDF publications into a flip-book with our unique Google optimized e-Paper software.
Environment, Food and Rural Affairs Committee: Evidence Ev 75<br />
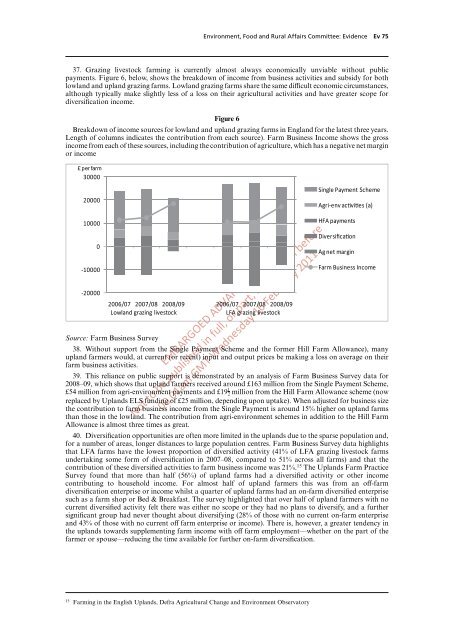
37. Graz<strong>in</strong>g livestock farm<strong>in</strong>g is currently almost always economically unviable without public<br />
payments. Figure 6, below, shows <strong>the</strong> breakdown of <strong>in</strong>come from bus<strong>in</strong>ess activities and subsidy for both<br />
lowland and upland graz<strong>in</strong>g farms. Lowland graz<strong>in</strong>g farms share <strong>the</strong> same diYcult economic circumstances,<br />
although typically make slightly less of a loss on <strong>the</strong>ir agricultural activities and have greater scope for<br />
diversification <strong>in</strong>come.<br />
Figure 6<br />
Breakdown of <strong>in</strong>come sources for lowland and upland graz<strong>in</strong>g farms <strong>in</strong> England for <strong>the</strong> latest three years.<br />
Length of columns <strong>in</strong>dicates <strong>the</strong> contribution from each source). Farm Bus<strong>in</strong>ess Income shows <strong>the</strong> gross<br />
<strong>in</strong>come from each of <strong>the</strong>se sources, <strong>in</strong>clud<strong>in</strong>g <strong>the</strong> contribution of agriculture, which has a negative net marg<strong>in</strong><br />
or <strong>in</strong>come<br />
£ per farm<br />
30000<br />
20000<br />
10000<br />
0<br />
-10000<br />
-20000<br />
2006/07 2007/08 2008/09 2006/07 2007/08 2008/09<br />
Lowland graz<strong>in</strong>g livestock LFA graz<strong>in</strong>g livestock<br />
EMBARGOED ADVANCE COPY:<br />
Not to be published <strong>in</strong> full, or part, <strong>in</strong> any form before<br />
00.01am GMT Wednesday 16 February 2011<br />
S<strong>in</strong>gle Payment Scheme<br />
Agri-env acvies (a)<br />
HFA payments<br />
Diversificaon<br />
Ag net marg<strong>in</strong><br />
Farm Bus<strong>in</strong>ess Income<br />
Source: Farm Bus<strong>in</strong>ess Survey<br />
38. Without support from <strong>the</strong> S<strong>in</strong>gle Payment Scheme and <strong>the</strong> former Hill Farm Allowance), many<br />
upland farmers would, at current (or recent) <strong>in</strong>put and output prices be mak<strong>in</strong>g a loss on average on <strong>the</strong>ir<br />
farm bus<strong>in</strong>ess activities.<br />
39. This reliance on public support is demonstrated by an analysis of Farm Bus<strong>in</strong>ess Survey data for<br />
2008–09, which shows that upland farmers received around £163 million from <strong>the</strong> S<strong>in</strong>gle Payment Scheme,<br />
£54 million from agri-environment payments and £19 1 2 million from <strong>the</strong> Hill Farm Allowance scheme (now<br />
replaced by <strong>Uplands</strong> ELS fund<strong>in</strong>g of £25 million, depend<strong>in</strong>g upon uptake). When adjusted for bus<strong>in</strong>ess size<br />
<strong>the</strong> contribution to farm bus<strong>in</strong>ess <strong>in</strong>come from <strong>the</strong> S<strong>in</strong>gle Payment is around 15% higher on upland farms<br />
than those <strong>in</strong> <strong>the</strong> lowland. The contribution from agri-environment schemes <strong>in</strong> addition to <strong>the</strong> Hill Farm<br />
Allowance is almost three times as great.<br />
40. Diversification opportunities are often more limited <strong>in</strong> <strong>the</strong> uplands due to <strong>the</strong> sparse population and,<br />
for a number of areas, longer distances to large population centres. Farm Bus<strong>in</strong>ess Survey data highlights<br />
that LFA farms have <strong>the</strong> lowest proportion of diversified activity (41% of LFA graz<strong>in</strong>g livestock farms<br />
undertak<strong>in</strong>g some form of diversification <strong>in</strong> 2007–08, compared to 51% across all farms) and that <strong>the</strong><br />
contribution of <strong>the</strong>se diversified activities to farm bus<strong>in</strong>ess <strong>in</strong>come was 21%. 15 The <strong>Uplands</strong> Farm Practice<br />
Survey found that more than half (56%) of upland farms had a diversified activity or o<strong>the</strong>r <strong>in</strong>come<br />
contribut<strong>in</strong>g to household <strong>in</strong>come. For almost half of upland farmers this was from an oV-farm<br />
diversification enterprise or <strong>in</strong>come whilst a quarter of upland farms had an on-farm diversified enterprise<br />
such as a farm shop or Bed & Breakfast. The survey highlighted that over half of upland farmers with no<br />
current diversified activity felt <strong>the</strong>re was ei<strong>the</strong>r no scope or <strong>the</strong>y had no plans to diversify, and a fur<strong>the</strong>r<br />
significant group had never thought about diversify<strong>in</strong>g (28% of those with no current on-farm enterprise<br />
and 43% of those with no current oV farm enterprise or <strong>in</strong>come). There is, however, a greater tendency <strong>in</strong><br />
<strong>the</strong> uplands towards supplement<strong>in</strong>g farm <strong>in</strong>come with oV farm employment—whe<strong>the</strong>r on <strong>the</strong> part of <strong>the</strong><br />
farmer or spouse—reduc<strong>in</strong>g <strong>the</strong> time available for fur<strong>the</strong>r on-farm diversification.<br />
15 <strong>Farm<strong>in</strong>g</strong> <strong>in</strong> <strong>the</strong> English <strong>Uplands</strong>, <strong>Defra</strong> Agricultural Change and Environment Observatory