
You also want an ePaper? Increase the reach of your titles
YUMPU automatically turns print PDFs into web optimized ePapers that Google loves.
DRAFT, February 18, 2003, Page 100<br />
Many additional features are planned for the debugger. See Future Plans (future/missing features) for<br />
details.<br />
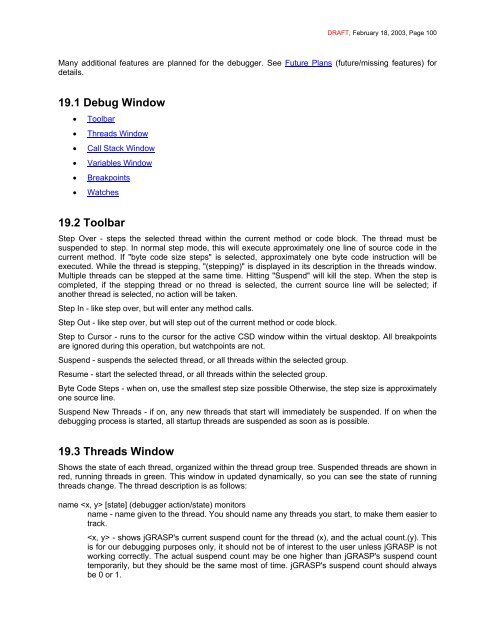
19.1 Debug Window<br />
• Toolbar<br />
• Threads Window<br />
• Call Stack Window<br />
• Variables Window<br />
• Breakpoints<br />
• Watches<br />
19.2 Toolbar<br />
Step Over - steps the selected thread within the current method or code block. The thread must be<br />
suspended to step. In normal step mode, this will execute approximately one line of source code in the<br />
current method. If "byte code size steps" is selected, approximately one byte code instruction will be<br />
executed. While the thread is stepping, "(stepping)" is displayed in its description in the threads window.<br />
Multiple threads can be stepped at the same time. Hitting "Suspend" will kill the step. When the step is<br />
completed, if the stepping thread or no thread is selected, the current source line will be selected; if<br />
another thread is selected, no action will be taken.<br />
Step In - like step over, but will enter any method calls.<br />
Step Out - like step over, but will step out of the current method or code block.<br />
Step to Cursor - runs to the cursor for the active CSD window within the virtual desktop. All breakpoints<br />
are ignored during this operation, but watchpoints are not.<br />
Suspend - suspends the selected thread, or all threads within the selected group.<br />
Resume - start the selected thread, or all threads within the selected group.<br />
Byte Code Steps - when on, use the smallest step size possible Otherwise, the step size is approximately<br />
one source line.<br />
Suspend New Threads - if on, any new threads that start will immediately be suspended. If on when the<br />
debugging process is started, all startup threads are suspended as soon as is possible.<br />
19.3 Threads Window<br />
Shows the state of each thread, organized within the thread group tree. Suspended threads are shown in<br />
red, running threads in green. This window in updated dynamically, so you can see the state of running<br />
threads change. The thread description is as follows:<br />
name [state] (debugger action/state) monitors<br />
name - name given to the thread. You should name any threads you start, to make them easier to<br />
track.<br />
- shows jGRASP's current suspend count for the thread (x), and the actual count.(y). This<br />
is for our debugging purposes only, it should not be of interest to the user unless jGRASP is not<br />
working correctly. The actual suspend count may be one higher than jGRASP's suspend count<br />
temporarily, but they should be the same most of time. jGRASP's suspend count should always<br />
be 0 or 1.