You also want an ePaper? Increase the reach of your titles
YUMPU automatically turns print PDFs into web optimized ePapers that Google loves.
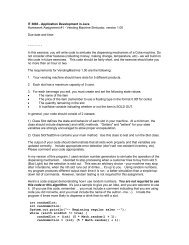
indicates these fields were inherited from Book.<br />
DRAFT, February 18, 2003, Page 68<br />
As you continue to step though your program, you should see output of the program displayed in the Run<br />
I/O window in the lower half of the Desktop. Eventually, you should reach the end of the program and<br />
see it terminate. When this occurs the debug pane and its subpanes should become blank, indicating<br />
that the program is no longer running.<br />
Now we are ready to make a second pass and “step in” to the methods called. Tracing through a<br />
program by following the calls to methods can be quite instructive in the obvious way. In the objectoriented<br />
paradigm, it is quite useful for illustrating the concept of constructors. As before, we need to run<br />
the example program in the debugger by clicking Run – Debug on the CSD Window menu or by clicking<br />
the debug symbol on the toolbar. After arriving at the breakpoint, we “step in” and the constructor for<br />
class Book pops up in the CSD Window (Figure 53). You can then step through this method in the usual<br />
way, eventually returning to the statement in the main program that called the constructor.<br />
FIGURE 53. After next stepping into the Book constructor