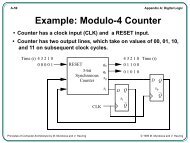
You also want an ePaper? Increase the reach of your titles
YUMPU automatically turns print PDFs into web optimized ePapers that Google loves.
DRAFT, February 18, 2003, Page 103<br />
Each data set value is scaled in the display, by the weight used in computing the total complexity, unless<br />
there is only one data set, in which case it is shown unscaled.<br />
The label at the top of the CPG window shows the complexity values of the segment under the mouse<br />
cursor. If the weight of a particular data set is not 1.0, the value and weight are displayed.<br />
The scale button allows the graph to be scaled, from two-pixel wide bars to screen-width bars.<br />
If "Scroll Lock" is on, the CPG window and the CSD window from which it was generated will scroll as<br />
one. This option is not available if the source has been edited.<br />
A scrollbar at the bottom of the window allows the CPG to be scrolled if it does not fit in the window.<br />
• File Menu<br />
• Data Sets Menu<br />
• View Menu<br />
21.1 File Menu<br />
Save Data - allows CPG complexity values to be saved in a straightforward text format.<br />
Escape From Virtual Desktop / Enter Virtual Desktop - takes the CPG window in and out of the virtual<br />
desktop.<br />
Disconnect From Source - dissociates the CPG window from the source CSD window. A second CPG<br />
window can then be generated from the same source.<br />
Exit This Window - closes the CPG window.<br />
21.2 Data Sets Menu<br />
This menu allows each data set to be turned off or on.<br />
21.3 View Menu<br />
Vertical Orientation - if on, the segments axis is vertical, and the complexity horizontal.<br />
Show Key - if on, a key that shows the color for each data set is shown (if there is more than one active<br />
data set).<br />
Show Axis Labels - if on, the segment and complexity axes are labeled. If there is only one active data<br />
set, the complexity axis is labeled with the name of that data set, otherwise it is labeled with "complexity".<br />
Show Number Labels - if on, segment and complexity axes have value labels. The labels are evenly<br />
spaced based on a minimum inter-label separation.<br />
22 UML Class Dependency Diagrams<br />
jGRASP can produce a UML diagram for Java code. The diagram is generated for classes in the source,<br />
class, and jar files in the current project. These diagrams are generated directly from the class (or jar)<br />
files, so source files must first be compiled.