Download (3223Kb) - White Rose Research Online
Download (3223Kb) - White Rose Research Online
Download (3223Kb) - White Rose Research Online

You also want an ePaper? Increase the reach of your titles
YUMPU automatically turns print PDFs into web optimized ePapers that Google loves.
14<br />
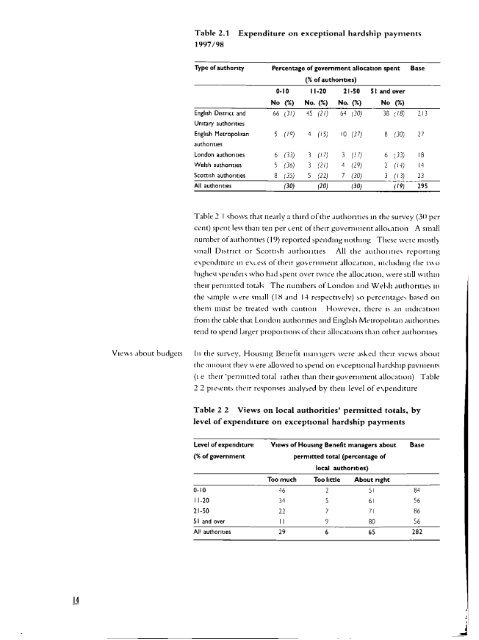
Table 2.1 Expenditure on exceptional hardship payments<br />
1997/98<br />
Type of authority Percentage of government allocation spent Base<br />
(% of authorities)<br />
0-10 11-20 21-50 51 andover<br />
No (%) No. (%) No. (%) No (%)<br />
English District and 66 (3)) ‘15 (2)) 64 (30) 38 ((8) 213<br />
Unitary authorities<br />
English Metropolian 5 (/0) 4 (/5) 0 (37) 8 (30) 27<br />
authorities<br />
London authorities 6 (33) 3 (/ 7) 3 (/7) 6 33) IS<br />
Welih authorities 5 (35) 3 (2/) 4 (29) 2 (/4) ‘1<br />
Scottish authorities S ç35) 5 (22) 7 (30) 3 (/3) 23<br />
All authorities (30) (20) (30) ff9) 295<br />
Table 2 I shows that nearly a third oldie authorities in the survey (3ff per<br />
cent) spemi t less than ten per cent of their govern inent allocation A small<br />
number ofauthionties (19) reported spemiding iiothinmg These wen e nmostl~<br />
small District or Scottish atithon ities All the author ities reportm mig<br />
expenditure iii e\cess of their go~t’rimrnent allocation, including thie tss<br />
hsighest spenideis who had spemit over twice thie allocation, were still within<br />
their permitted totals The nitimisbers of London and Welsh authorities in<br />
the sample ssere small (18 arid 14 respectively) so percentages based on<br />
theni miiust he treated with caution Howevem, there is aim indication<br />
froni the table that Lonidoii authorities amid Emiglish Metropolitan authorities<br />
tend to spend larger propon tions ofthemr allocations than other atithiornties<br />
Views about budgets In the siir~ev,Housing Benefit nmanngers were asked their views about<br />
the aiiiount they ~sere allowed to spend on exceptional hardship payments<br />
(m e their ‘permitted total mathet than their governumseni allocation) Table<br />
2 2 presents their responses analysed by theim level of expenditure<br />
Table 2 2 Views on local authorities’ permitted totals, by<br />
level of expenditure on exceptional hardship payments<br />
Level of expenditure Views of Housing Benefit managers about Base<br />
(% of government permitted total (percentage of<br />
local authorities)<br />
Too much Too little About right<br />
0-10 46 2 51 84<br />
11-20 31 5 61 56<br />
21-50 22 7 71 86<br />
51 and over II 9 80 56<br />
All authorities 29 6 65 282<br />
_______ j