Download (3223Kb) - White Rose Research Online
Download (3223Kb) - White Rose Research Online
Download (3223Kb) - White Rose Research Online

You also want an ePaper? Increase the reach of your titles
YUMPU automatically turns print PDFs into web optimized ePapers that Google loves.
— belo~s<br />
esceptiona] hardship payuileuits was generally low uiianv Housing Benefit<br />
managers considered their allocation to be ‘aboLit right’ haecaiise it ~sould<br />
allow theuii to cope with expected increases in demand in the future<br />
Local authoriry benefit departinenits do not collect data omi the number of<br />
restricted rent awards they make, but it is possible to get a sense from the<br />
quarterly returuis that local authorities submit to DSS containing data on<br />
the number of Rent Othcer restrictions iii force in the relevant qLimuter<br />
For the purposes of this research DSS supplied statistics omi the number<br />
of Rent Officer restrictions in Ibrce in each local authority for the first<br />
three quitters of 1997/98 (QI to Q3) This allows us to get a sense of<br />
the order of magnitude of potential demiiand for exceptional hardship<br />
payinemits For each authority, the number of Rent Officer restnctionis mi<br />
force iii ~ , Q2, and Q3 was k no~cii By taking the maximum value we<br />
have aim indicator of potential denianid in a particular quarter This cannot<br />
be trauislited unto the potential demand over the whole year because<br />
there are flows into and out 0 f the register of restricted rents Many<br />
claiin.iiits will appean in the statistics for all four quarters of the year<br />
Furthermore, claimants do uior have to apply for a payinemit whemi their<br />
claim is detenuimmied They iii my ‘s ish to apply at soiiie point during the<br />
benefit period when they timid they are iii hardship What we caul say<br />
however us that the potential demand for exceptional hardship payimients<br />
wuld not be lc~sthan the imiaxiniunu figure f~ rent restrictions iii the year<br />
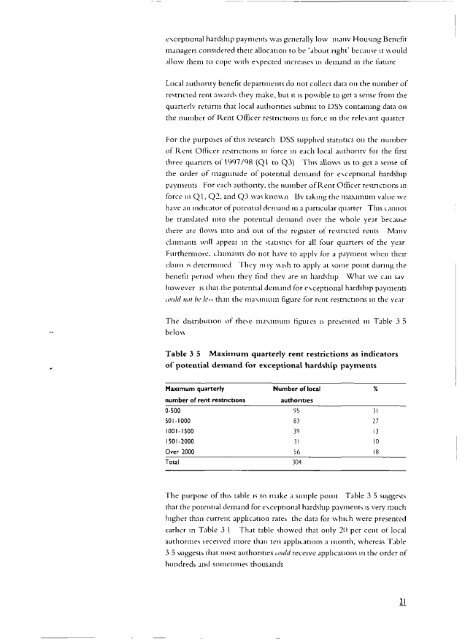
The distrubLution of these uiia\uilitmnii figures is presenited iii Table 3 5<br />
Table 3 5 Maxitrium quarterly rent restrictions as indicators<br />
of potential demand for exceptional hardship payments<br />
Maximum quarterly Number of local<br />
number of rent restrictions authorities<br />
0-500 95 31<br />
501-1000 83 27<br />
1001-1500 39 13<br />
1501-2000 31 10<br />
Over 2000 56 18<br />
Total 304<br />
The purpose of this table is to make a simple point Table 3 5 suggests<br />
that the potential deniamid for es.ceptronal hardship paynients is very nitich<br />
higher than current application rates the data for which were presented<br />
earlier in Table 3 1 That table showed that only 20 per cent of local<br />
authorities received illore than ten applicatiomis a month, whereas Table<br />
3 5 suggests that most authorities wmmld receive applications iii the order of<br />
hundreds amid sonietinimes thousands<br />
ii