Master of Science - ETD | Electronic Theses and Dissertations of ...
Master of Science - ETD | Electronic Theses and Dissertations of ...
Master of Science - ETD | Electronic Theses and Dissertations of ...

Create successful ePaper yourself
Turn your PDF publications into a flip-book with our unique Google optimized e-Paper software.
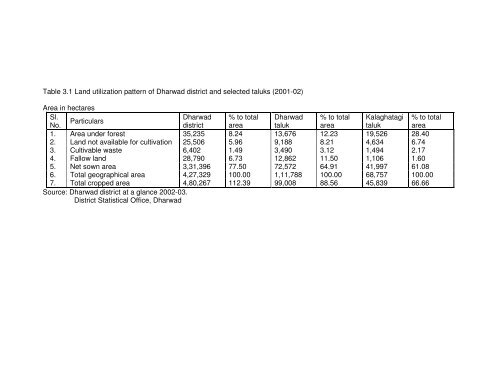
Table 3.1 L<strong>and</strong> utilization pattern <strong>of</strong> Dharwad district <strong>and</strong> selected taluks (2001-02)<br />
Area in hectares<br />
Sl.<br />
No. Particulars<br />
Dharwad<br />
district<br />
% to total<br />
area<br />
Dharwad<br />
taluk<br />
% to total<br />
area<br />
Kalaghatagi<br />
taluk<br />
% to total<br />
area<br />
1. Area under forest 35,235 8.24 13,676 12.23 19,526 28.40<br />
2. L<strong>and</strong> not available for cultivation 25,506 5.96 9,188 8.21 4,634 6.74<br />
3. Cultivable waste 6,402 1.49 3,490 3.12 1,494 2.17<br />
4. Fallow l<strong>and</strong> 28,790 6.73 12,862 11.50 1,106 1.60<br />
5. Net sown area 3,31,396 77.50 72,572 64.91 41,997 61.08<br />
6. Total geographical area 4,27,329 100.00 1,11,788 100.00 68,757 100.00<br />
7. Total cropped area 4,80,267 112.39 99,008 88.56 45,839 66.66<br />
Source: Dharwad district at a glance 2002-03.<br />
District Statistical Office, Dharwad