Master of Science - ETD | Electronic Theses and Dissertations of ...
Master of Science - ETD | Electronic Theses and Dissertations of ...
Master of Science - ETD | Electronic Theses and Dissertations of ...

Create successful ePaper yourself
Turn your PDF publications into a flip-book with our unique Google optimized e-Paper software.
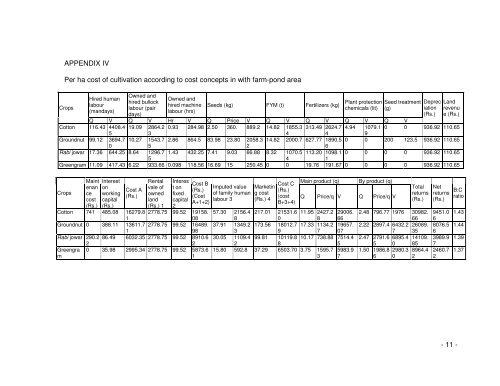
APPENDIX IV<br />
Per ha cost <strong>of</strong> cultivation according to cost concepts in with farm-pond area<br />
Crops<br />
Hired human<br />
labour<br />
(m<strong>and</strong>ays)<br />
Owned <strong>and</strong><br />
hired bullock<br />
labour (pair<br />
days)<br />
Owned <strong>and</strong><br />
hired machine<br />
labour (hrs)<br />
Seeds (kg) FYM (t)<br />
Plant protection Seed treatment Deprec L<strong>and</strong><br />
Fertilizers (kg)<br />
chemicals (lit) (g)<br />
iation revenu<br />
(Rs.) e (Rs.)<br />
Q V Q V Hr V Q Price V Q V Q V Q V Q V<br />
Cotton 116.43 4408.4 19.09 2864.2 0.93 284.98 2.50 360. 889.2 14.82 1855.3 313.49 2624.7 4.94 1079.1 0 0 936.92 110.65<br />
5<br />
3<br />
4<br />
4<br />
9<br />
Groundnut 99.12 3694.7 10.27 1543.7 2.86 864.5 83.98 23.80 2058.3 14.82 2000.7 627.77 1890.5 0 0 200 123.5 936.92 110.65<br />
0<br />
5<br />
2<br />
6<br />
Rabi jowar 17.36 644.25 8.64 1296.7 1.43 432.25 7.41 9.03 66.88 8.32 1070.5 113.20 1098.1 0 0 0 0 936.92 110.65<br />
5<br />
4<br />
1<br />
Greengram 11.09 417.43 6.22 933.66 0.098 118.56 16.69 15 250.45 0 0 19.76 191.67 0 0 0 0 936.92 110.65<br />
Crops<br />
Maint Interest<br />
enan on<br />
ce working<br />
cost capital<br />
(Rs.) (Rs.)<br />
Cost A<br />
(Rs.)<br />
Rental<br />
vale <strong>of</strong><br />
owned<br />
l<strong>and</strong><br />
(Rs.) 1<br />
Interes<br />
Cost B<br />
Cost C<br />
t on<br />
Imputed value Marketin<br />
(Rs.)<br />
(Rs.)<br />
fixed <strong>of</strong> family human g cost<br />
(Cost<br />
(cost<br />
capital labour 3 (Rs.) 4<br />
A+1+2)<br />
B+3+4)<br />
2<br />
Main product (q)<br />
Q Price/q V<br />
By product (q)<br />
Q Price/q V<br />
Total Net<br />
B:C<br />
returns returns<br />
ratio<br />
(Rs.) (Rs.)<br />
Cotton 741 485.08 16279.8 2778.75 99.52 19158. 57.30 2156.4 217.01 21531.6 11.95 2427.2 29006. 2.48 796.77 1976 30982. 9451.0 1.43<br />
1<br />
08<br />
8<br />
0<br />
8 66<br />
66 6<br />
Groundnut 0 388.11 13611.7 2778.75 99.52 16489. 37.91 1349.2 173.56 18012.7 17.33 1134.2 19657. 2.22 2897.4 6432.2 26089. 8076.5 1.44<br />
1<br />
98<br />
3<br />
9<br />
7 07<br />
7 35 6<br />
Rabi jowar 290.2 86.49 6032.35 2778.75 99.52 8910.6 30.05 1109.4 99.81 10119.8 10.17 738.88 7514.4 2.47 2791.6 6895.4 14109. 3989.9 1.39<br />
2<br />
2<br />
2<br />
8<br />
5<br />
5 0 85 7<br />
Greengra 0 35.98 2995.34 2778.75 99.52 5873.6 15.80 592.8 37.29 6503.70 3.75 1595.7 5983.9 1.50 1986.8 2980.3 8964.4 2460.7 1.37<br />
m<br />
1<br />
3 7<br />
6 0 2 2<br />
- 11 -