Master of Science - ETD | Electronic Theses and Dissertations of ...
Master of Science - ETD | Electronic Theses and Dissertations of ...
Master of Science - ETD | Electronic Theses and Dissertations of ...

Create successful ePaper yourself
Turn your PDF publications into a flip-book with our unique Google optimized e-Paper software.
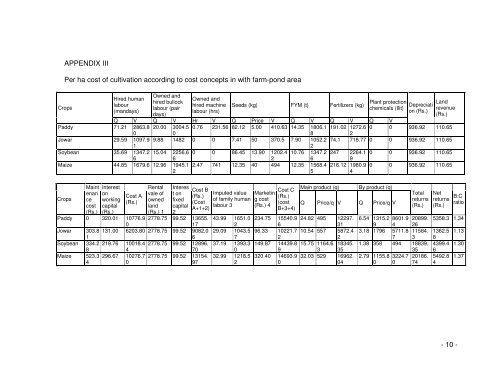
APPENDIX III<br />
Per ha cost <strong>of</strong> cultivation according to cost concepts in with farm-pond area<br />
Crops<br />
Hired human<br />
labour<br />
(m<strong>and</strong>ays)<br />
Owned <strong>and</strong><br />
hired bullock<br />
labour (pair<br />
days)<br />
Owned <strong>and</strong><br />
hired machine<br />
labour (hrs)<br />
Seeds (kg) FYM (t)<br />
Plant protection<br />
Fertilizers (kg) Depreciati<br />
chemicals (Ilit)<br />
on (Rs.)<br />
L<strong>and</strong><br />
revenue<br />
(Rs.)<br />
Q V Q V Hr V Q Price V Q V Q V Q V<br />
Paddy 71.21 2863.8 20.00 3004.5 0.76 231.56 82.12 5.00 410.63 14.35 1806.1 191.02 1272.6 0 0 936.92 110.65<br />
0<br />
0<br />
8<br />
2<br />
Jowar 29.59 1097.9 9.88 1482 0 0 7.41 50 370.5 7.90 1052.2 74.1 718.77 0 0 936.92 110.65<br />
1<br />
2<br />
Soybean 35.69 1347.2 15.04 2256.6 0 0 86.45 13.90 1202.4 10.76 1347.2 247 2264.1 0 0 936.92 110.65<br />
6<br />
6<br />
2<br />
6<br />
9<br />
Maize 44.85 1679.6 12.96 1945.1 2.47 741 12.35 40 494 12.35 1568.4 216.12 1980.9 0 0 936.92 110.65<br />
2<br />
5<br />
4<br />
Crops<br />
Maint Interest<br />
enan on<br />
ce working<br />
cost capital<br />
(Rs.) (Rs.)<br />
Cost A<br />
(Rs.)<br />
Rental<br />
vale <strong>of</strong><br />
owned<br />
l<strong>and</strong><br />
(Rs.) 1<br />
Interes<br />
Cost B<br />
Cost C<br />
t on<br />
Imputed value Marketin<br />
(Rs.)<br />
(Rs.)<br />
fixed <strong>of</strong> family human g cost<br />
(Cost<br />
(cost<br />
capital labour 3 (Rs.) 4<br />
A+1+2)<br />
B+3+4)<br />
2<br />
Main product (q)<br />
Q Price/q V<br />
By product (q)<br />
Q Price/q V<br />
Total Net<br />
B:C<br />
returns returns<br />
ratio<br />
(Rs.) (Rs.)<br />
Paddy 0 320.01 10776.9 2778.75 99.52 13655. 43.99 1651.0 234.75 15540.9 24.82 495 12297. 6.54 1315.2 8601.9 20899. 5358.3 1.34<br />
0<br />
17<br />
2<br />
6<br />
31<br />
9 4 26<br />
Jowar 303.8 131.00 6203.80 2778.75 99.52 9082.0 29.09 1043.5 96.33 10221.7 10.54 557 5872.4 3.18 1796 5711.8 11584. 1362.5 1.13<br />
1<br />
6<br />
7<br />
2<br />
2<br />
7 3 8<br />
Soybean 334.2 218.76 10018.4 2778.75 99.52 12896. 37.19 1393.3 149.87 14439.8 15.75 1164.6 18345. 1.38 358 494 18839. 4399.4 1.30<br />
8<br />
4<br />
70<br />
0<br />
9<br />
3 35<br />
35 6<br />
Maize 523.3 296.67 10276.7 2778.75 99.52 13154. 32.99 1218.5 320.40 14693.9 32.03 529 16962. 2.79 1155.8 3224.7 20186. 5492.8 1.37<br />
4<br />
0<br />
97<br />
2<br />
0<br />
04<br />
0 0 74 4<br />
- 10 -