Master of Science - ETD | Electronic Theses and Dissertations of ...
Master of Science - ETD | Electronic Theses and Dissertations of ...
Master of Science - ETD | Electronic Theses and Dissertations of ...

You also want an ePaper? Increase the reach of your titles
YUMPU automatically turns print PDFs into web optimized ePapers that Google loves.
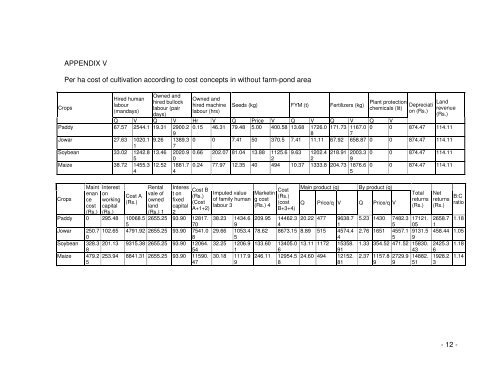
APPENDIX V<br />
Per ha cost <strong>of</strong> cultivation according to cost concepts in without farm-pond area<br />
Crops<br />
Hired human<br />
labour<br />
(m<strong>and</strong>ays)<br />
Owned <strong>and</strong><br />
hired bullock<br />
labour (pair<br />
days)<br />
Owned <strong>and</strong><br />
hired machine<br />
labour (hrs)<br />
Seeds (kg) FYM (t)<br />
Plant protection<br />
Fertilizers (kg) Depreciati<br />
chemicals (lit)<br />
on (Rs.)<br />
L<strong>and</strong><br />
revenue<br />
(Rs.)<br />
Q V Q V Hr V Q Price V Q V Q V Q V<br />
Paddy 67.57 2544.1 19.31 2900.2 0.15 46.31 79.48 5.00 400.58 13.68 1726.0 171.73 1167.0 0 0 874.47 114.11<br />
9<br />
8<br />
7<br />
Jowar 27.63 1020.1 9.26 1389.3 0 0 7.41 50 370.5 7.41 11.11 67.92 658.87 0 0 874.47 114.11<br />
1<br />
7<br />
Soybean 33.02 1242.8 13.46 2020.9 0.66 202.07 81.04 13.88 1125.6 9.63 1202.4 218.91 2003.3 0 0 874.47 114.11<br />
5<br />
0<br />
2<br />
2<br />
9<br />
Maize 38.72 1455.3 12.52 1881.7 0.24 77.97 12.35 40 494 10.37 1333.8 204.73 1876.6 0 0 874.47 114.11<br />
4<br />
4<br />
5<br />
Crops<br />
Maint Interest<br />
enan on<br />
ce working<br />
cost capital<br />
(Rs.) (Rs.)<br />
Cost A<br />
(Rs.)<br />
Rental<br />
vale <strong>of</strong><br />
owned<br />
l<strong>and</strong><br />
(Rs.) 1<br />
Interes<br />
Cost B<br />
Cost<br />
t on<br />
Imputed value Marketin<br />
(Rs.)<br />
(Rs.)<br />
fixed <strong>of</strong> family human g cost<br />
(Cost<br />
(cost<br />
capital labour 3 (Rs.) 4<br />
A+1+2)<br />
B+3+4)<br />
2<br />
Main product (q)<br />
Q Price/q V<br />
By product (q)<br />
Q Price/q V<br />
Total Net<br />
B:C<br />
returns returns<br />
ratio<br />
(Rs.) (Rs.)<br />
Paddy 0 295.48 10068.5 2655.25 93.90 12817. 38.23 1434.6 209.95 14462.3 20.22 477 9638.7 5.23 1430 7482.3 17121. 2658.7 1.18<br />
5<br />
70<br />
9<br />
4<br />
1<br />
5 05 1<br />
Jowar 250.7 102.65 4791.92 2655.25 93.90 7541.0 29.66 1053.4 78.62 8673.15 8.89 515 4574.4 2.76 1651 4557.1 9131.5 458.44 1.05<br />
0<br />
8<br />
5<br />
4<br />
5 9<br />
Soybean 328.3 201.13 9315.38 2655.25 93.90 12064. 32.25 1206.9 133.60 13405.0 13.11 1172 15358. 1.33 354.52 471.52 15830. 2425.3 1.18<br />
8<br />
54<br />
1<br />
6<br />
91<br />
43 6<br />
Maize 479.2 253.94 8841.31 2655.25 93.90 11590. 30.18 1117.9 246.11 12954.5 24.60 494 12152. 2.37 1157.8 2729.9 14882. 1928.2 1.14<br />
5<br />
47<br />
9<br />
8<br />
81<br />
9 9 51 3<br />
- 12 -