

Max Planck Institute for Astronomy - Annual Report 2007
Max Planck Institute for Astronomy - Annual Report 2007
Max Planck Institute for Astronomy - Annual Report 2007

You also want an ePaper? Increase the reach of your titles
YUMPU automatically turns print PDFs into web optimized ePapers that Google loves.
26 II. Highlights<br />
F 1 [5]<br />
–2<br />
0<br />
2<br />
4<br />
6<br />
8<br />
10<br />
12<br />
14<br />
0<br />
a<br />
HD172555A H = 4.3<br />
Eri 2004oct H = 1.9<br />
Ind A 2004oct H = 2.3<br />
HD114613 H = 3.3<br />
HD17925 H = 4.2<br />
0.5 1<br />
Distance from primary<br />
1.5 2<br />
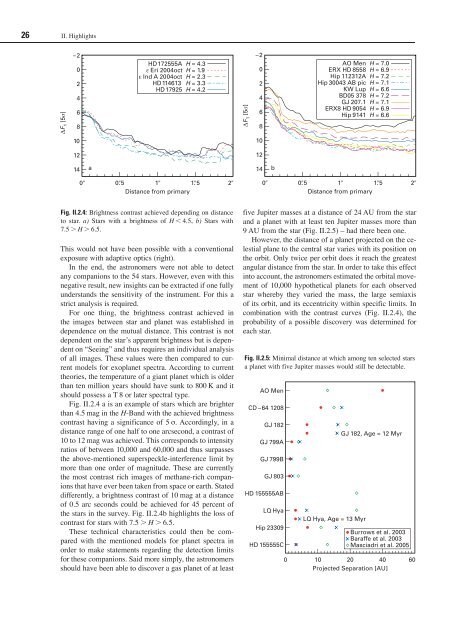
Fig. II.2.4: Brightness contrast achieved depending on distance<br />
to star. a) Stars with a brightness of H 4.5, b) Stars with<br />
7.5 H 6.5.<br />
This would not have been possible with a conventional<br />
exposure with adaptive optics (right).<br />
In the end, the astronomers were not able to detect<br />
any companions to the 54 stars. However, even with this<br />
negative result, new insights can be extracted if one fully<br />
understands the sensitivity of the instrument. For this a<br />
strict analysis is required.<br />
For one thing, the brightness contrast achieved in<br />
the images between star and planet was established in<br />
dependence on the mutual distance. This contrast is not<br />
dependent on the star’s apparent brightness but is dependent<br />
on “Seeing” and thus requires an individual analysis<br />
of all images. These values were then compared to current<br />
models <strong>for</strong> exoplanet spectra. According to current<br />
theories, the temperature of a giant planet which is older<br />
than ten million years should have sunk to 800 K and it<br />
should possess a T 8 or later spectral type.<br />
Fig. II.2.4 a is an example of stars which are brighter<br />
than 4.5 mag in the H-Band with the achieved brightness<br />
contrast having a significance of 5 s. Accordingly, in a<br />
distance range of one half to one arcsecond, a contrast of<br />
10 to 12 mag was achieved. This corresponds to intensity<br />
ratios of between 10,000 and 60,000 and thus surpasses<br />
the above-mentioned superspeckle-interference limit by<br />
more than one order of magnitude. These are currently<br />
the most contrast rich images of methane-rich companions<br />
that have ever been taken from space or earth. Stated<br />
differently, a brightness contrast of 10 mag at a distance<br />
of 0.5 arc seconds could be achieved <strong>for</strong> 45 percent of<br />
the stars in the survey. Fig. II.2.4b highlights the loss of<br />
contrast <strong>for</strong> stars with 7.5 H 6.5.<br />
These technical characteristics could then be compared<br />
with the mentioned models <strong>for</strong> planet spectra in<br />
order to make statements regarding the detection limits<br />
<strong>for</strong> these companions. Said more simply, the astronomers<br />
should have been able to discover a gas planet of at least<br />
F 1 [5]<br />
–2<br />
0<br />
2<br />
4<br />
6<br />
8<br />
10<br />
12<br />
14<br />
0<br />
b<br />
AO Men H = 7.0<br />
ERX HD 8558 H = 6.9<br />
Hip 112312A H = 7.2<br />
Hip 30043 AB pic H = 7.1<br />
KW Lup H = 6.6<br />
BD05 378 H = 7.2<br />
GJ 207.1 H = 7.1<br />
ERX8 HD 9054 H = 6.9<br />
Hip 9141 H = 6.6<br />
0.5 1<br />
Distance from primary<br />
1.5 2<br />
five Jupiter masses at a distance of 24 AU from the star<br />
and a planet with at least ten Jupiter masses more than<br />
9 AU from the star (Fig. II.2.5) – had there been one.<br />
However, the distance of a planet projected on the celestial<br />
plane to the central star varies with its position on<br />
the orbit. Only twice per orbit does it reach the greatest<br />
angular distance from the star. In order to take this effect<br />
into account, the astronomers estimated the orbital movement<br />
of 10,000 hypothetical planets <strong>for</strong> each observed<br />
star whereby they varied the mass, the large semiaxis<br />
of its orbit, and its eccentricity within specific limits. In<br />
combination with the contrast curves (Fig. II.2.4), the<br />
probability of a possible discovery was determined <strong>for</strong><br />
each star.<br />
Fig. II.2.5: Minimal distance at which among ten selected stars<br />
a planet with five Jupiter masses would still be detectable.<br />
AO Men<br />
CD –64 1208<br />
GJ 182<br />
GJ 799A<br />
GJ 799B<br />
GJ 803<br />
HD 155555AB<br />
LQ Hya<br />
Hip 23309<br />
HD 155555C<br />
LQ Hya, Age = 13 Myr<br />
GJ 182, Age = 12 Myr<br />
Burrows et al. 2003<br />
Baraffe et al. 2003<br />
Masciadri et al. 2005<br />
0 10 20 40 60<br />
Projected Separation [AU]


