

Max Planck Institute for Astronomy - Annual Report 2007
Max Planck Institute for Astronomy - Annual Report 2007
Max Planck Institute for Astronomy - Annual Report 2007

You also want an ePaper? Increase the reach of your titles
YUMPU automatically turns print PDFs into web optimized ePapers that Google loves.
60 II. Highlights<br />
V [km s –1 ] V c [km s –1 ]<br />
V [km s –1 ] V c [km s –1 ]<br />
150<br />
100<br />
50<br />
0<br />
–50<br />
100<br />
50<br />
0<br />
–50<br />
NGC2403<br />
0<br />
0<br />
V5<br />
IC2574<br />
V5<br />
200 400 600<br />
r<br />
200<br />
800 1000 1200<br />
It is still unclear today whether all galaxies or at least<br />
each galaxy type follows a universal “Schmidt Law” or<br />
whether varying external conditions significantly influence<br />
the relationship between star <strong>for</strong>mation rate and gas<br />
density. This question is of great significance <strong>for</strong> theories<br />
and models of galaxy evolution.<br />
If one experimentally pursues the question, then it<br />
turns out to be useful to distinguish between the density<br />
of atomic (HI) and molecular gas (H 2 ). tH i N g s is<br />
especially suitable because of the high spatial resolution<br />
that it can achieve and its homogenous sensitivity. An<br />
astronomer team with Frank Bigiel, Adam Leroy, and<br />
Fabian Walter discussed this question by using data from<br />
the ga l e x Nearby Galaxy Survey and si N g s. From these<br />
the star <strong>for</strong>mation rate could be derived. In addition, CO<br />
observations with the 30 m ir a m telescope were available<br />
r<br />
400 600<br />
Fig. II.8.3: These rotation curves (blue) demonstrate how strongly<br />
the derived radial velocities vary depending on the method<br />
applied; above: the rotation-dominated galaxy, NGC 2403;<br />
below: IC 2574, in which strongly asymmetrical line profiles<br />
appear.<br />
log(V halo / km s –1 )<br />
2.5<br />
2<br />
1.5<br />
1<br />
0<br />
0.5<br />
log (V/km s –1 )<br />
3<br />
2<br />
1<br />
0<br />
–22<br />
–20 –18<br />
M B [mag]<br />
log(r) = 1<br />
–16 –14<br />
Fig. II.8.4: The rotation curves of all galaxies, sorted by absolute<br />
luminosities of the galaxies with a logarithmic representation<br />
of the rotation velocity.<br />
which permitted the derivation of the molecular hydrogen’s<br />
(H 2 ) density.<br />
Fig. II.8.6 shows the results (above) <strong>for</strong> spiral galaxies<br />
with H 2 -dominated central areas as well as (below) <strong>for</strong><br />
late spiral and dwarf galaxies. The values are listed in relation<br />
to averaged radius and azimuth. One sees how star<br />
<strong>for</strong>mation rates and H 2 -density decrease in spiral galaxies<br />
with growing distance, while the HI density does not follow<br />
this trend. In Fig. II.8.7, these measurements <strong>for</strong> the<br />
spiral galaxies were then plotted such that the SFR can<br />
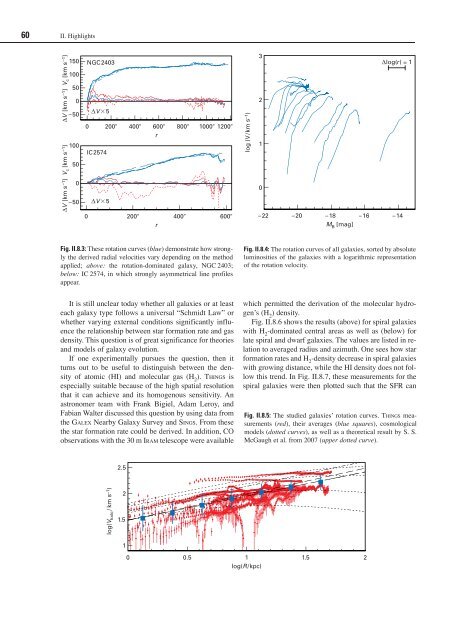
Fig. II.8.5: The studied galaxies’ rotation curves. tH i N g s measurements<br />
(red), their averages (blue squares), cosmological<br />
models (dotted curves), as well as a theoretical result by S. S.<br />
McGaugh et al. from <strong>2007</strong> (upper dotted curve).<br />
1<br />
log(R/kpc)<br />
1.5 2


