

Max Planck Institute for Astronomy - Annual Report 2007
Max Planck Institute for Astronomy - Annual Report 2007
Max Planck Institute for Astronomy - Annual Report 2007

Create successful ePaper yourself
Turn your PDF publications into a flip-book with our unique Google optimized e-Paper software.
46 II. Highlights<br />
F [10 –23 W cm –2 nm –1 ]<br />
2.5<br />
2<br />
1.5<br />
1<br />
0.5<br />
0<br />
2.5<br />
2<br />
1.5<br />
1<br />
0.5<br />
0<br />
2.5<br />
2<br />
1.5<br />
1<br />
0.5<br />
0<br />
2.5<br />
2<br />
1.5<br />
1<br />
0.5<br />
0<br />
2.5<br />
2<br />
1.5<br />
1<br />
0.5<br />
0<br />
280 300 320<br />
1.9<br />
1.9<br />
1.9<br />
1.9<br />
1.9<br />
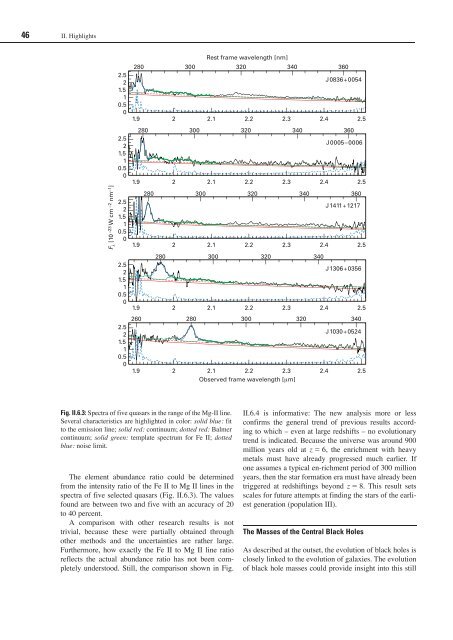
The element abundance ratio could be determined<br />
from the intensity ratio of the Fe II to Mg II lines in the<br />
spectra of five selected quasars (Fig. II.6.3). The values<br />
found are between two and five with an accuracy of 20<br />
to 40 percent.<br />
A comparison with other research results is not<br />
trivial, because these were partially obtained through<br />
other methods and the uncertainties are rather large.<br />
Furthermore, how exactly the Fe II to Mg II line ratio<br />
reflects the actual abundance ratio has not been completely<br />
understood. Still, the comparison shown in Fig.<br />
Rest frame wavelength [nm]<br />
340 360<br />
J0836+0054<br />
2 2.1 2.2 2.3 2.4 2.5<br />
280 300 320 340 360<br />
J0005–0006<br />
2 2.1 2.2 2.3 2.4 2.5<br />
280 300 320 340 360<br />
J1411+1217<br />
2 2.1 2.2 2.3 2.4 2.5<br />
280 300 320 340<br />
J1306+0356<br />
2 2.1 2.2 2.3 2.4 2.5<br />
260 280 300 320 340<br />
Fig. II.6.3: Spectra of five quasars in the range of the Mg-II line.<br />
Several characteristics are highlighted in color: solid blue: fit<br />
to the emission line; solid red: continuum; dotted red: Balmer<br />
continuum; solid green: template spectrum <strong>for</strong> Fe II; dotted<br />
blue: noise limit.<br />
J1030+0524<br />
2 2.1 2.2 2.3 2.4 2.5<br />
Observed frame wavelength [m]<br />
II.6.4 is in<strong>for</strong>mative: The new analysis more or less<br />
confirms the general trend of previous results according<br />
to which – even at large redshifts – no evolutionary<br />
trend is indicated. Because the universe was around 900<br />
million years old at z 6, the enrichment with heavy<br />
metals must have already progressed much earlier. If<br />
one assumes a typical en-richment period of 300 million<br />
years, then the star <strong>for</strong>mation era must have already been<br />
triggered at redshiftings beyond z 8. This result sets<br />
scales <strong>for</strong> future attempts at finding the stars of the earliest<br />
generation (population III).<br />
The Masses of the Central Black Holes<br />
As described at the outset, the evolution of black holes is<br />
closely linked to the evolution of galaxies. The evolution<br />
of black hole masses could provide insight into this still


