

Max Planck Institute for Astronomy - Annual Report 2007
Max Planck Institute for Astronomy - Annual Report 2007
Max Planck Institute for Astronomy - Annual Report 2007

Create successful ePaper yourself
Turn your PDF publications into a flip-book with our unique Google optimized e-Paper software.
FeII / MgII<br />
unknown interactive relationship. From the new data,<br />
these mass values can be ascertained in three different<br />
ways:<br />
•<br />
•<br />
•<br />
14<br />
12<br />
10<br />
8<br />
6<br />
4<br />
2<br />
0<br />
0<br />
Dietrich et al. 2003<br />
Maiolino et. al. 2003<br />
Freudling et. al. 2003<br />
Iwamuro et. al. 2004<br />
Barth et. al. 2003<br />
This work<br />
Iwamuro et al. 2002<br />
Thompson et al. 1999<br />
1 2 3<br />
Redshift z<br />
4 5 6<br />
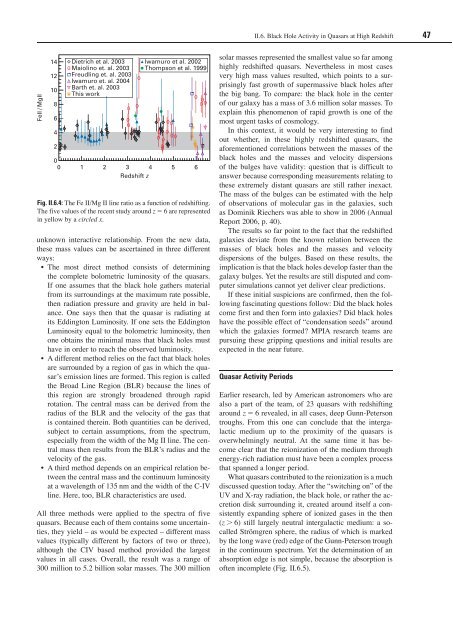
Fig. II.6.4: The Fe II/Mg II line ratio as a function of redshifting.<br />
The five values of the recent study around z 6 are represented<br />
in yellow by a circled x.<br />
The most direct method consists of determining<br />
the complete bolometric luminosity of the quasars.<br />
If one assumes that the black hole gathers material<br />
from its surroundings at the maximum rate possible,<br />
then radiation pressure and gravity are held in balance.<br />
One says then that the quasar is radiating at<br />
its Eddington Luminosity. If one sets the Eddington<br />
Luminosity equal to the bolometric luminosity, then<br />
one obtains the minimal mass that black holes must<br />
have in order to reach the observed luminosity.<br />
A different method relies on the fact that black holes<br />
are surrounded by a region of gas in which the quasar’s<br />
emission lines are <strong>for</strong>med. This region is called<br />
the Broad Line Region (BLR) because the lines of<br />
this region are strongly broadened through rapid<br />
rotation. The central mass can be derived from the<br />
radius of the BLR and the velocity of the gas that<br />
is contained therein. Both quantities can be derived,<br />
subject to certain assumptions, from the spectrum,<br />
especially from the width of the Mg II line. The central<br />
mass then results from the BLR’s radius and the<br />
velocity of the gas.<br />
A third method depends on an empirical relation be-<br />
tween the central mass and the continuum luminosity<br />
at a wavelength of 135 nm and the width of the C-IV<br />
line. Here, too, BLR characteristics are used.<br />
All three methods were applied to the spectra of five<br />
quasars. Because each of them contains some uncertainties,<br />
they yield – as would be expected – different mass<br />
values (typically different by factors of two or three),<br />
although the CIV based method provided the largest<br />
values in all cases. Overall, the result was a range of<br />
300 million to 5.2 billion solar masses. The 300 million<br />
II.6. Black Hole Activity in Quasars at High Redshift 47<br />
solar masses represented the smallest value so far among<br />
highly redshifted quasars. Nevertheless in most cases<br />
very high mass values resulted, which points to a surprisingly<br />
fast growth of supermassive black holes after<br />
the big bang. To compare: the black hole in the center<br />
of our galaxy has a mass of 3.6 million solar masses. To<br />
explain this phenomenon of rapid growth is one of the<br />
most urgent tasks of cosmology.<br />
In this context, it would be very interesting to find<br />
out whether, in these highly redshifted quasars, the<br />
a<strong>for</strong>ementioned correlations between the masses of the<br />
black holes and the masses and velocity dispersions<br />
of the bulges have validity: question that is difficult to<br />
answer because corresponding measurements relating to<br />
these extremely distant quasars are still rather inexact.<br />
The mass of the bulges can be estimated with the help<br />
of observations of molecular gas in the galaxies, such<br />
as Dominik Riechers was able to show in 2006 (<strong>Annual</strong><br />
<strong>Report</strong> 2006, p. 40).<br />
The results so far point to the fact that the redshifted<br />
galaxies deviate from the known relation between the<br />
masses of black holes and the masses and velocity<br />
dispersions of the bulges. Based on these results, the<br />
implication is that the black holes develop faster than the<br />
galaxy bulges. Yet the results are still disputed and computer<br />
simulations cannot yet deliver clear predictions.<br />
If these initial suspicions are confirmed, then the following<br />
fascinating questions follow: Did the black holes<br />
come first and then <strong>for</strong>m into galaxies? Did black holes<br />
have the possible effect of “condensation seeds” around<br />
which the galaxies <strong>for</strong>med? MPIA research teams are<br />
pursuing these gripping questions and initial results are<br />
expected in the near future.<br />
Quasar Activity Periods<br />
Earlier research, led by American astronomers who are<br />
also a part of the team, of 23 quasars with redshifting<br />
around z 6 revealed, in all cases, deep Gunn-Peterson<br />
troughs. From this one can conclude that the intergalactic<br />
medium up to the proximity of the quasars is<br />
overwhelmingly neutral. At the same time it has become<br />
clear that the reionization of the medium through<br />
energy-rich radiation must have been a complex process<br />
that spanned a longer period.<br />
What quasars contributed to the reionization is a much<br />
discussed question today. After the “switching on” of the<br />
UV and X-ray radiation, the black hole, or rather the accretion<br />
disk surrounding it, created around itself a consistently<br />
expanding sphere of ionized gases in the then<br />
(z 6) still largely neutral intergalactic medium: a socalled<br />
Strömgren sphere, the radius of which is marked<br />
by the long wave (red) edge of the Gunn-Peterson trough<br />
in the continuum spectrum. Yet the determination of an<br />
absorption edge is not simple, because the absorption is<br />
often incomplete (Fig. II.6.5).


