

Max Planck Institute for Astronomy - Annual Report 2007
Max Planck Institute for Astronomy - Annual Report 2007
Max Planck Institute for Astronomy - Annual Report 2007

Create successful ePaper yourself
Turn your PDF publications into a flip-book with our unique Google optimized e-Paper software.
58 II. Highlights<br />
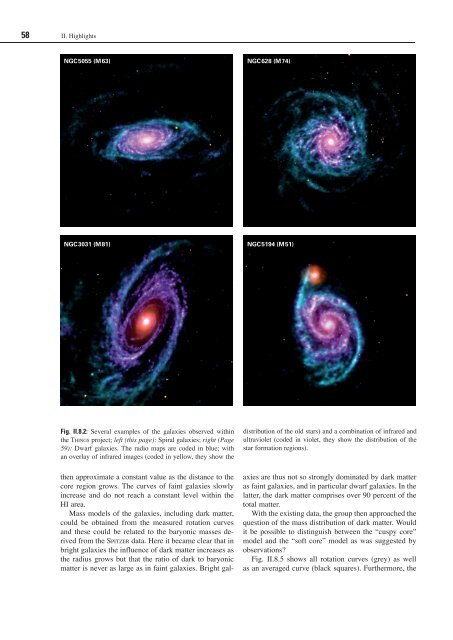
NGC5055 (M63) NGC628 (M74)<br />
NGC3031 (M81) NGC5194 (M51)<br />
Fig. II.8.2: Several examples of the galaxies observed within<br />
the tH i N g s project; left (this page): Spiral galaxies; right (Page<br />
59): Dwarf galaxies. The radio maps are coded in blue; with<br />
an overlay of infrared images (coded in yellow, they show the<br />
then approximate a constant value as the distance to the<br />
core region grows. The curves of faint galaxies slowly<br />
increase and do not reach a constant level within the<br />
HI area.<br />
Mass models of the galaxies, including dark matter,<br />
could be obtained from the measured rotation curves<br />
and these could be related to the baryonic masses derived<br />
from the sp i t z e r data. Here it became clear that in<br />
bright galaxies the influence of dark matter increases as<br />
the radius grows but that the ratio of dark to baryonic<br />
matter is never as large as in faint galaxies. Bright gal-<br />
distribution of the old stars) and a combination of infrared and<br />
ultraviolet (coded in violet, they show the distribution of the<br />
star <strong>for</strong>mation regions).<br />
axies are thus not so strongly dominated by dark matter<br />
as faint galaxies, and in particular dwarf galaxies. In the<br />
latter, the dark matter comprises over 90 percent of the<br />
total matter.<br />
With the existing data, the group then approached the<br />
question of the mass distribution of dark matter. Would<br />
it be possible to distinguish between the “cuspy core”<br />
model and the “soft core” model as was suggested by<br />
observations?<br />
Fig. II.8.5 shows all rotation curves (grey) as well<br />
as an averaged curve (black squares). Furthermore, the


