

Max Planck Institute for Astronomy - Annual Report 2007
Max Planck Institute for Astronomy - Annual Report 2007
Max Planck Institute for Astronomy - Annual Report 2007

You also want an ePaper? Increase the reach of your titles
YUMPU automatically turns print PDFs into web optimized ePapers that Google loves.
36 II. Highlights<br />
F / F 12m<br />
4<br />
3<br />
2<br />
1<br />
0<br />
8 10 12<br />
Wavelength [m]<br />
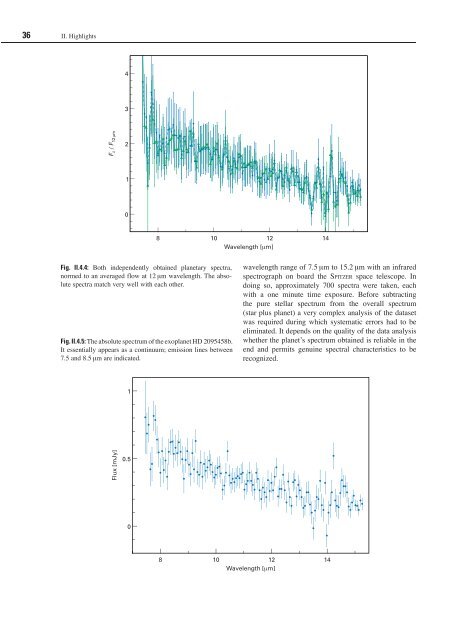
Fig. II.4.4: Both independently obtained planetary spectra,<br />
normed to an averaged flow at 12 µm wavelength. The absolute<br />
spectra match very well with each other.<br />
Fig. II.4.5: The absolute spectrum of the exoplanet HD 2095458b.<br />
It essentially appears as a continuum; emission lines between<br />
7.5 and 8.5 µm are indicated.<br />
Flux [mJy]<br />
1<br />
0.5<br />
0<br />
8<br />
14<br />
wavelength range of 7.5 µm to 15.2 µm with an infrared<br />
spectrograph on board the sp i t z e r space telescope. In<br />
doing so, approximately 700 spectra were taken, each<br />
with a one minute time exposure. Be<strong>for</strong>e subtracting<br />
the pure stellar spectrum from the overall spectrum<br />
(star plus planet) a very complex analysis of the dataset<br />
was required during which systematic errors had to be<br />
eliminated. It depends on the quality of the data analysis<br />
whether the planet’s spectrum obtained is reliable in the<br />
end and permits genuine spectral characteristics to be<br />
recognized.<br />
10 12<br />
Wavelength [m]<br />
14


