Baseline study Fish, fry and commercial fishery Nysted Offshore ...
Baseline study Fish, fry and commercial fishery Nysted Offshore ...
Baseline study Fish, fry and commercial fishery Nysted Offshore ...

You also want an ePaper? Increase the reach of your titles
YUMPU automatically turns print PDFs into web optimized ePapers that Google loves.
Bio/consult as Page 83<br />
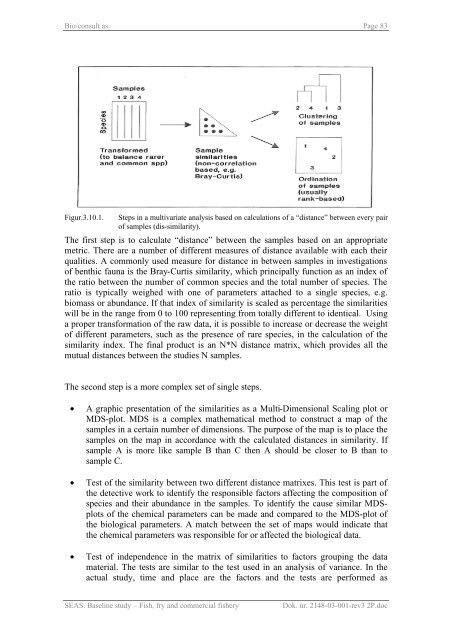
Figur.3.10.1. Steps in a multivariate analysis based on calculations of a “distance” between every pair<br />
of samples (dis-similarity).<br />
The first step is to calculate “distance” between the samples based on an appropriate<br />
metric. There are a number of different measures of distance available with each their<br />
qualities. A commonly used measure for distance in between samples in investigations<br />
of benthic fauna is the Bray-Curtis similarity, which principally function as an index of<br />
the ratio between the number of common species <strong>and</strong> the total number of species. The<br />
ratio is typically weighed with one of parameters attached to a single species, e.g.<br />
biomass or abundance. If that index of similarity is scaled as percentage the similarities<br />
will be in the range from 0 to 100 representing from totally different to identical. Using<br />
a proper transformation of the raw data, it is possible to increase or decrease the weight<br />
of different parameters, such as the presence of rare species, in the calculation of the<br />
similarity index. The final product is an N*N distance matrix, which provides all the<br />
mutual distances between the studies N samples.<br />
The second step is a more complex set of single steps.<br />
• A graphic presentation of the similarities as a Multi-Dimensional Scaling plot or<br />
MDS-plot. MDS is a complex mathematical method to construct a map of the<br />
samples in a certain number of dimensions. The purpose of the map is to place the<br />
samples on the map in accordance with the calculated distances in similarity. If<br />
sample A is more like sample B than C then A should be closer to B than to<br />
sample C.<br />
• Test of the similarity between two different distance matrixes. This test is part of<br />
the detective work to identify the responsible factors affecting the composition of<br />
species <strong>and</strong> their abundance in the samples. To identify the cause similar MDSplots<br />
of the chemical parameters can be made <strong>and</strong> compared to the MDS-plot of<br />
the biological parameters. A match between the set of maps would indicate that<br />
the chemical parameters was responsible for or affected the biological data.<br />
• Test of independence in the matrix of similarities to factors grouping the data<br />
material. The tests are similar to the test used in an analysis of variance. In the<br />
actual <strong>study</strong>, time <strong>and</strong> place are the factors <strong>and</strong> the tests are performed as<br />
SEAS. <strong>Baseline</strong> <strong>study</strong> – <strong>Fish</strong>, <strong>fry</strong> <strong>and</strong> <strong>commercial</strong> <strong>fishery</strong> Dok. nr. 2148-03-001-rev3 2P.doc