Introduction to Stata 8
Introduction to Stata 8
Introduction to Stata 8

Create successful ePaper yourself
Turn your PDF publications into a flip-book with our unique Google optimized e-Paper software.
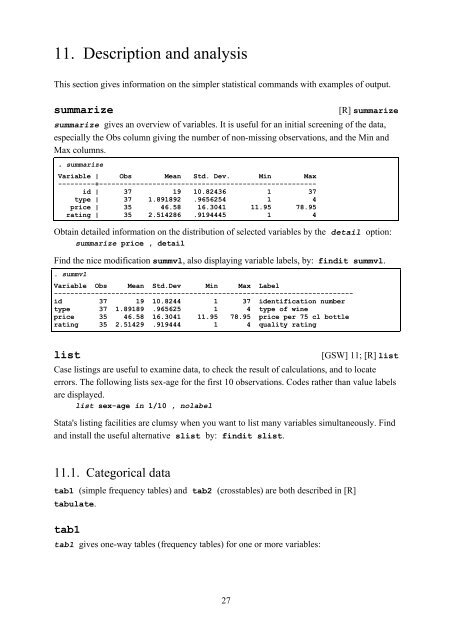
11. Description and analysis<br />
This section gives information on the simpler statistical commands with examples of output.<br />
summarize [R] summarize<br />
summarize gives an overview of variables. It is useful for an initial screening of the data,<br />
especially the Obs column giving the number of non-missing observations, and the Min and<br />
Max columns.<br />
. summarize<br />
Variable | Obs Mean Std. Dev. Min Max<br />
---------+-----------------------------------------------------<br />
id | 37 19 10.82436 1 37<br />
type | 37 1.891892 .9656254 1 4<br />
price | 35 46.58 16.3041 11.95 78.95<br />
rating | 35 2.514286 .9194445 1 4<br />
Obtain detailed information on the distribution of selected variables by the detail option:<br />
summarize price , detail<br />
Find the nice modification summvl, also displaying variable labels, by: findit summvl.<br />
. summvl<br />
Variable Obs Mean Std.Dev Min Max Label<br />
-------------------------------------------------------------------------<br />
id 37 19 10.8244 1 37 identification number<br />
type 37 1.89189 .965625 1 4 type of wine<br />
price 35 46.58 16.3041 11.95 78.95 price per 75 cl bottle<br />
rating 35 2.51429 .919444 1 4 quality rating<br />
list [GSW] 11; [R] list<br />
Case listings are useful <strong>to</strong> examine data, <strong>to</strong> check the result of calculations, and <strong>to</strong> locate<br />
errors. The following lists sex-age for the first 10 observations. Codes rather than value labels<br />
are displayed.<br />
list sex-age in 1/10 , nolabel<br />
<strong>Stata</strong>'s listing facilities are clumsy when you want <strong>to</strong> list many variables simultaneously. Find<br />
and install the useful alternative slist by: findit slist.<br />
11.1. Categorical data<br />
tab1 (simple frequency tables) and tab2 (crosstables) are both described in [R]<br />
tabulate.<br />
tab1<br />
tab1 gives one-way tables (frequency tables) for one or more variables:<br />
27