Introduction to Stata 8
Introduction to Stata 8
Introduction to Stata 8

Create successful ePaper yourself
Turn your PDF publications into a flip-book with our unique Google optimized e-Paper software.
c:\dokumenter\...\gph.birthweight.do<br />
u se "C:\dokumenter\...\newborns.dta" , clear<br />
set<br />
scheme lean2<br />
his<strong>to</strong>gram bweight ///<br />
, ///<br />
frequency ///<br />
normal ///<br />
start(750) width(250) ///<br />
xlabel(1000(500)5000) ///<br />
xmticks(##2) ///<br />
xtitle("Birthweight, grams") ///<br />
ytitle("N of children") ///<br />
plotregion(margin(b=0)) ///<br />
xsize(4) ysize(2.3) scale(1.4)<br />
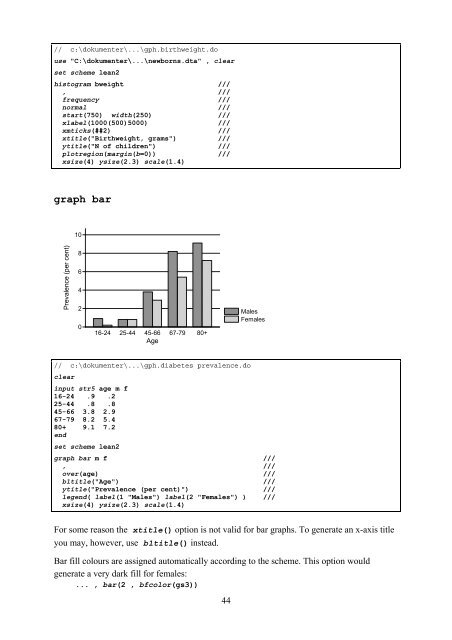
graph bar<br />
Prevalence (per cent)<br />
10<br />
8<br />
6<br />
4<br />
2<br />
0<br />
16-24 25-44 45-66 67-79 80+<br />
Age<br />
/ / c:\dokumenter\...\gph.diabetes prevalence.do<br />
clear<br />
input str5 age m f<br />
16-24 .9 .2<br />
25-44 .8 .8<br />
45-66 3.8 2.9<br />
67-79 8.2 5.4<br />
80+ 9.1 7.2<br />
end<br />
set<br />
scheme lean2<br />
Males<br />
Females<br />
graph bar m f ///<br />
, ///<br />
over(age) ///<br />
b1title("Age") ///<br />
ytitle("Prevalence (per cent)") ///<br />
legend( label(1 "Males") label(2 "Females") ) ///<br />
xsize(4) ysize(2.3) scale(1.4)<br />
For some reason the xtitle() option is not valid for bar graphs. To generate an x-axis title<br />
you may, however, use b1title() instead.<br />
Bar fill colours are assigned au<strong>to</strong>matically according <strong>to</strong> the scheme. This option would<br />
generate a very dark fill for females:<br />
... , bar(2 , bfcolor(gs3))<br />
44