Introduction to Stata 8
Introduction to Stata 8
Introduction to Stata 8

Create successful ePaper yourself
Turn your PDF publications into a flip-book with our unique Google optimized e-Paper software.
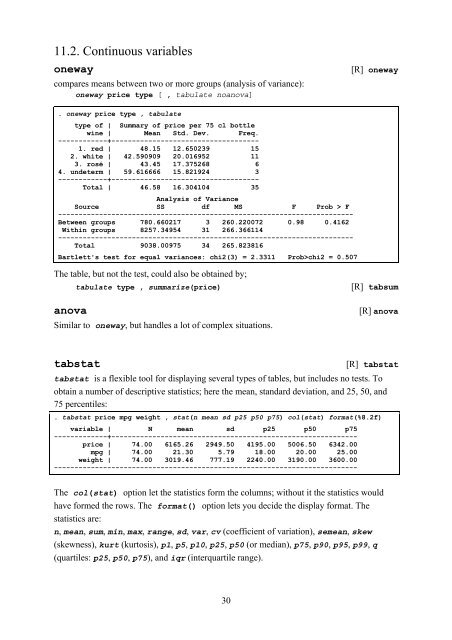
11.2. Continuous variables<br />
oneway [R] oneway<br />
compares means between two or more groups (analysis of variance):<br />
oneway price type [ , tabulate noanova]<br />
. oneway price type , tabulate<br />
type of | Summary of price per 75 cl bottle<br />
wine | Mean Std. Dev. Freq.<br />
------------+------------------------------------<br />
1. red | 48.15 12.650239 15<br />
2. white | 42.590909 20.016952 11<br />
3. rosé | 43.45 17.375268 6<br />
4. undeterm | 59.616666 15.821924 3<br />
------------+------------------------------------<br />
Total | 46.58 16.304104 35<br />
Analysis of Variance<br />
Source SS df MS F Prob > F<br />
------------------------------------------------------------------------<br />
Between groups 780.660217 3 260.220072 0.98 0.4162<br />
Within groups 8257.34954 31 266.366114<br />
------------------------------------------------------------------------<br />
Total 9038.00975 34 265.823816<br />
Bartlett's test for equal variances: chi2(3) = 2.3311 Prob>chi2 = 0.507<br />
The table, but not the test, could also be obtained by;<br />
tabulate type , summarize(price) [R] tabsum<br />
anova [R] anova<br />
Similar <strong>to</strong> oneway, but handles a lot of complex situations.<br />
tabstat [R] tabstat<br />
tabstat is a flexible <strong>to</strong>ol for displaying several types of tables, but includes no tests. To<br />
obtain a number of descriptive statistics; here the mean, standard deviation, and 25, 50, and<br />
75 percentiles:<br />
.<br />
tabstat price mpg weight , stat(n mean sd p25 p50 p75) col(stat) format(%8.2f)<br />
variable | N mean sd p25 p50 p75<br />
-------------+------------------------------------------------------------<br />
price | 74.00 6165.26 2949.50 4195.00 5006.50 6342.00<br />
mpg | 74.00 21.30 5.79 18.00 20.00 25.00<br />
weight | 74.00 3019.46 777.19 2240.00 3190.00 3600.00<br />
--------------------------------------------------------------------------<br />
The col(stat) option let the statistics form the columns; without it the statistics would<br />
have formed the rows. The format() option lets you decide the display format. The<br />
statistics are:<br />
n, mean, sum, min, max, range, sd, var, cv (coefficient of variation), semean, skew<br />
(skewness), kurt (kur<strong>to</strong>sis), p1, p5, p10, p25, p50 (or median), p75, p90, p95, p99, q<br />
(quartiles: p25, p50, p75), and iqr (interquartile range).<br />
30