Introduction to Stata 8
Introduction to Stata 8
Introduction to Stata 8

Create successful ePaper yourself
Turn your PDF publications into a flip-book with our unique Google optimized e-Paper software.
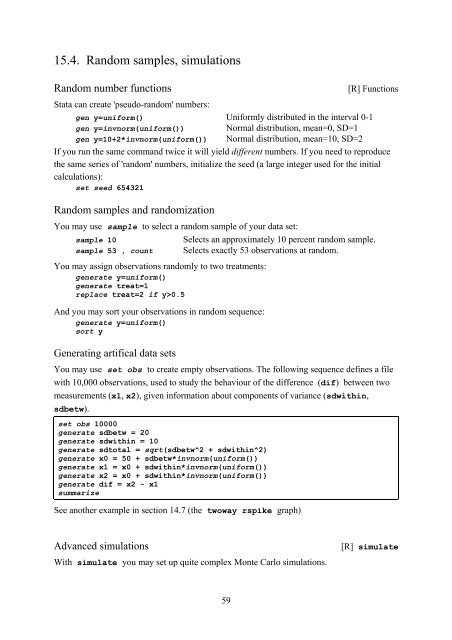
15.4. Random samples, simulations<br />
Random number functions [R] Functions<br />
<strong>Stata</strong> can create 'pseudo-random' numbers:<br />
gen y=uniform() Uniformly distributed in the interval 0-1<br />
gen y=invnorm(uniform()) Normal distribution, mean=0, SD=1<br />
gen y=10+2*invnorm(uniform()) Normal distribution, mean=10, SD=2<br />
If you run the same command twice it will yield different numbers. If you need <strong>to</strong> reproduce<br />
the same series of 'random' numbers, initialize the seed (a large integer used for the initial<br />
calculations):<br />
set seed 654321<br />
Random samples and randomization<br />
You may use sample <strong>to</strong> select a random sample of your data set:<br />
sample 10 Selects an approximately 10 percent random sample.<br />
sample 53 , count Selects exactly 53 observations at random.<br />
You may assign observations randomly <strong>to</strong> two treatments:<br />
generate y=uniform()<br />
generate treat=1<br />
replace treat=2 if y>0.5<br />
And you may sort your observations in random sequence:<br />
generate y=uniform()<br />
sort y<br />
Generating artifical data sets<br />
You may use set obs <strong>to</strong> create empty observations. The following sequence defines a file<br />
with 10,000 observations, used <strong>to</strong> study the behaviour of the difference (dif) between two<br />
measurements (x1, x2), given information about components of variance (sdwithin,<br />
sdbetw).<br />
set obs 10000<br />
generate sdbetw = 20<br />
generate sdwithin = 10<br />
generate sd<strong>to</strong>tal = sqrt(sdbetw^2 + sdwithin^2)<br />
generate x0 = 50 + sdbetw*invnorm(uniform())<br />
generate x1 = x0 + sdwithin*invnorm(uniform())<br />
generate x2 = x0 + sdwithin*invnorm(uniform())<br />
generate dif = x2 - x1<br />
summarize<br />
See another example in section 14.7 (the twoway rspike graph)<br />
Advanced simulations [R] simulate<br />
With simulate you may set up quite complex Monte Carlo simulations.<br />
59