Introduction to Stata 8
Introduction to Stata 8
Introduction to Stata 8

You also want an ePaper? Increase the reach of your titles
YUMPU automatically turns print PDFs into web optimized ePapers that Google loves.
In bar graphs the x-axis is categorical, the y-axis continuous. In the example variables m and<br />
f defined the heights of the bars, but actually graph bar used the default mean function,<br />
as if the command were (with one observation per bar the result is the same):<br />
graph bar (mean) m f , over(age)<br />
With the au<strong>to</strong>.dta data you could generate bars for the number of domestic and foreign<br />
cars by:<br />
graph bar (count) mpg , over(foreign)<br />
Actually what is counted is the number of non-missing values of mpg.<br />
Bar graphs are documented in [G] graph bar and [G] graph twoway bar.<br />
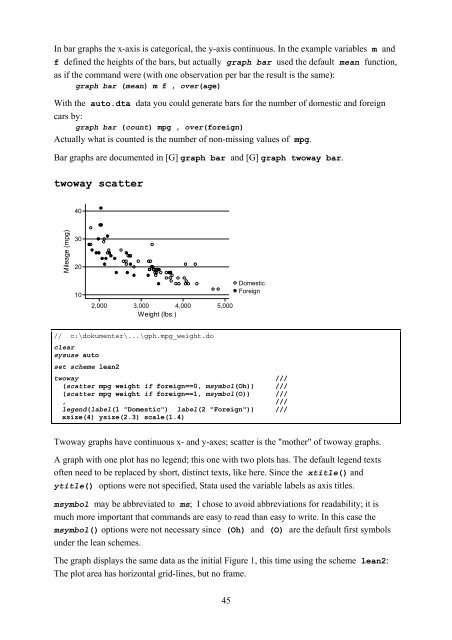
twoway<br />
scatter<br />
Mileage (mpg)<br />
40<br />
30<br />
20<br />
10<br />
2,000 3,000 4,000 5,000<br />
Weight (lbs.)<br />
/ / c:\dokumenter\...\gph.mpg_weight.do<br />
clear<br />
sysuse<br />
au<strong>to</strong><br />
set<br />
scheme lean2<br />
Domestic<br />
Foreign<br />
twoway ///<br />
(scatter mpg weight if foreign==0, msymbol(Oh)) ///<br />
(scatter mpg weight if foreign==1, msymbol(O)) ///<br />
, ///<br />
legend(label(1 "Domestic") label(2 "Foreign")) ///<br />
xsize(4) ysize(2.3) scale(1.4)<br />
Twoway graphs have continuous x- and y-axes; scatter is the "mother" of twoway graphs.<br />
A graph with one plot has no legend; this one with two plots has. The default legend texts<br />
often need <strong>to</strong> be replaced by short, distinct texts, like here. Since the xtitle() and<br />
ytitle() options were not specified, <strong>Stata</strong> used the variable labels as axis titles.<br />
msymbol may be abbreviated <strong>to</strong> ms; I chose <strong>to</strong> avoid abbreviations for readability; it is<br />
much more important that commands are easy <strong>to</strong> read than easy <strong>to</strong> write. In this case the<br />
msymbol() options were not necessary since (Oh) and (O) are the default first symbols<br />
under the lean schemes.<br />
The graph displays the same data as the initial Figure 1, this time using the scheme lean2:<br />
The plot area has horizontal grid-lines, but no frame.<br />
45