Introduction to Stata 8
Introduction to Stata 8
Introduction to Stata 8

You also want an ePaper? Increase the reach of your titles
YUMPU automatically turns print PDFs into web optimized ePapers that Google loves.
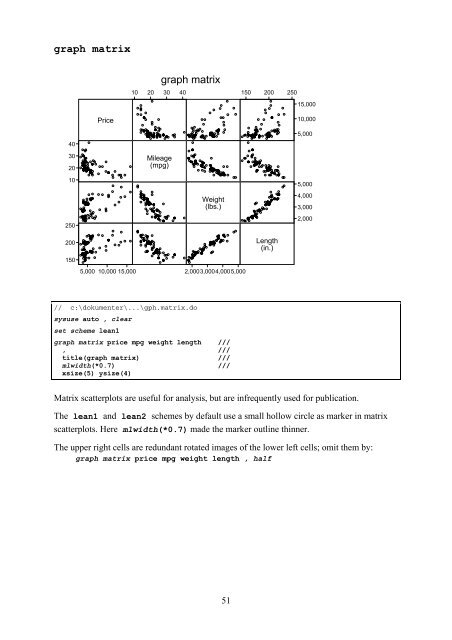
graph matrix<br />
40<br />
30<br />
20<br />
10<br />
250<br />
200<br />
150<br />
Price<br />
5,000 10,000 15,000<br />
10 20 30 40<br />
Mileage<br />
(mpg)<br />
graph matrix<br />
// c:\dokumenter\...\gph.matrix.do<br />
sysuse au<strong>to</strong> , clear<br />
set scheme lean1<br />
Weight<br />
(lbs.)<br />
2,0003,0004,0005,000<br />
graph matrix price mpg weight length ///<br />
, ///<br />
title(graph matrix) ///<br />
mlwidth(*0.7) ///<br />
xsize(5) ysize(4)<br />
150 200 250<br />
Length<br />
(in.)<br />
15,000<br />
10,000<br />
Matrix scatterplots are useful for analysis, but are infrequently used for publication.<br />
The lean1 and lean2 schemes by default use a small hollow circle as marker in matrix<br />
scatterplots. Here mlwidth(*0.7) made the marker outline thinner.<br />
The upper right cells are redundant rotated images of the lower left cells; omit them by:<br />
graph matrix price mpg weight length , half<br />
51<br />
5,000<br />
5,000<br />
4,000<br />
3,000<br />
2,000