

Characterization of the U.S. Industrial Commercial Boiler Population
Characterization of the U.S. Industrial Commercial Boiler Population
Characterization of the U.S. Industrial Commercial Boiler Population

Create successful ePaper yourself
Turn your PDF publications into a flip-book with our unique Google optimized e-Paper software.
2 CHARACTERIZATION OF INDUSTRIAL<br />
BOILERS<br />
2.1 Overview<br />
EEA estimates that <strong>the</strong>re are approximately 43,000 industrial boilers in <strong>the</strong> United States<br />
with an aggregate capacity <strong>of</strong> 1.5 million MMBtu/hr input. Slightly more than half <strong>of</strong><br />
<strong>the</strong>se boilers are less than 10 MMBtu/hr capacity but <strong>the</strong>se small boilers account for less<br />
than seven percent <strong>of</strong> <strong>the</strong> total capacity. The majority <strong>of</strong> <strong>the</strong> boilers and <strong>the</strong> largest<br />
boilers are located at facilities in <strong>the</strong> food, paper, chemicals, refining and primary metals<br />
industries. Almost 78 percent <strong>of</strong> boiler units and 56 percent <strong>of</strong> industrial boiler capacity<br />
are identified as natural gas-fired, although certain industries (refining, paper, primary<br />
metals) have large shares <strong>of</strong> boiler capacity that are fired with by-product fuels. <strong>Industrial</strong><br />
boilers are found in every census region but are more concentrated in <strong>the</strong> East North<br />
Central (ENC), South Atlantic (SA) and West South Central (WSC) regions, 2 which<br />
contain more than 60 percent <strong>of</strong> <strong>the</strong> capacity.<br />
2.2 Breakdown by Industry<br />
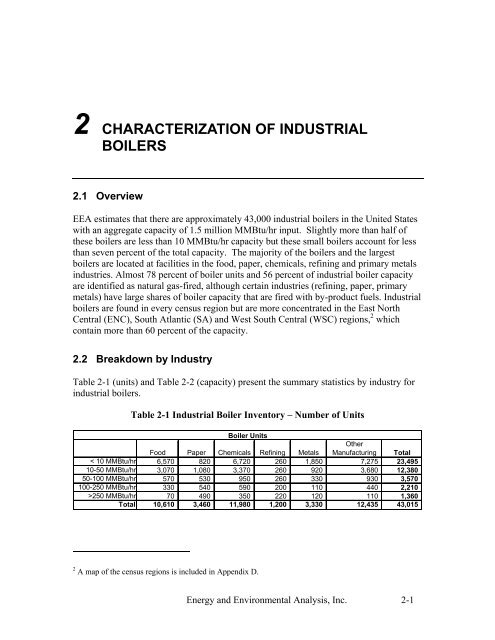
Table 2-1 (units) and Table 2-2 (capacity) present <strong>the</strong> summary statistics by industry for<br />
industrial boilers.<br />
Table 2-1 <strong>Industrial</strong> <strong>Boiler</strong> Inventory – Number <strong>of</strong> Units<br />
<strong>Boiler</strong> Units<br />
Food Paper Chemicals Refining Metals<br />
< 10 MMBtu/hr 6,570 820 6,720 260 1,850<br />
10-50 MMBtu/hr 3,070 1,080 3,370 260 920<br />
50-100 MMBtu/hr 570 530 950 260 330<br />
100-250 MMBtu/hr 330 540 590 200 110<br />
>250 MMBtu/hr 70 490 350 220 120<br />
Total 10,610 3,460 11,980 1,200 3,330<br />
2 A map <strong>of</strong> <strong>the</strong> census regions is included in Appendix D.<br />
O<strong>the</strong>r<br />
Manufacturing Total<br />
7,275 23,495<br />
3,680 12,380<br />
930 3,570<br />
440 2,210<br />
110 1,360<br />
12,435 43,015<br />
Energy and Environmental Analysis, Inc. 2-1


