

Characterization of the U.S. Industrial Commercial Boiler Population
Characterization of the U.S. Industrial Commercial Boiler Population
Characterization of the U.S. Industrial Commercial Boiler Population

Create successful ePaper yourself
Turn your PDF publications into a flip-book with our unique Google optimized e-Paper software.
<strong>of</strong>ten is blended with coke oven gas or blast furnace gas because <strong>the</strong>se by-product fuels<br />
have relatively low heating value (e.g., 500 Btu/cf for coke oven gas, 80 Btu/cf for blast<br />
furnace gas). The primary metals industry is concentrated in <strong>the</strong> East North Central<br />
region, where 54 percent <strong>of</strong> boiler capacity is located. Much <strong>of</strong> <strong>the</strong> rest <strong>of</strong> <strong>the</strong> boiler<br />
capacity is located in <strong>the</strong> Mid Atlantic and South Atlantic regions.<br />
2.2.6 O<strong>the</strong>r Manufacturing<br />
The remaining industries account for about 29 percent <strong>of</strong> industrial boilers (12,000 units)<br />
and just 18 percent <strong>of</strong> industrial boiler capacity. <strong>Boiler</strong>s at <strong>the</strong>se facilities have an<br />
average capacity <strong>of</strong> 23 MMBtu/hr and most are smaller than 10 MMBtu/hr.<br />
Approximately 100 boilers at o<strong>the</strong>r manufacturing facilities have capacities larger than<br />
250 MMBtu/hr.<br />
2.3 Breakdown by Fuel<br />
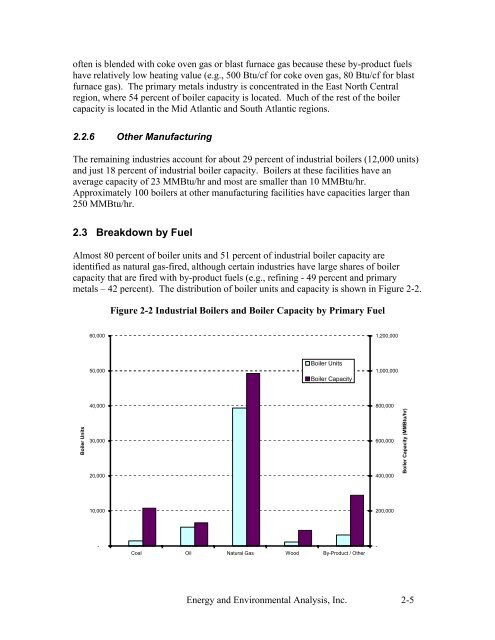
Almost 80 percent <strong>of</strong> boiler units and 51 percent <strong>of</strong> industrial boiler capacity are<br />
identified as natural gas-fired, although certain industries have large shares <strong>of</strong> boiler<br />
capacity that are fired with by-product fuels (e.g., refining - 49 percent and primary<br />
metals – 42 percent). The distribution <strong>of</strong> boiler units and capacity is shown in Figure 2-2.<br />
<strong>Boiler</strong> Units<br />
60,000<br />
50,000<br />
40,000<br />
30,000<br />
20,000<br />
10,000<br />
-<br />
Figure 2-2 <strong>Industrial</strong> <strong>Boiler</strong>s and <strong>Boiler</strong> Capacity by Primary Fuel<br />
<strong>Boiler</strong> Units<br />
<strong>Boiler</strong> Capacity<br />
Coal Oil Natural Gas Wood By-Product / O<strong>the</strong>r<br />
1,200,000<br />
1,000,000<br />
800,000<br />
600,000<br />
400,000<br />
200,000<br />
Energy and Environmental Analysis, Inc. 2-5<br />
-<br />
<strong>Boiler</strong> Capacity (MMBtu/hr)


