

Characterization of the U.S. Industrial Commercial Boiler Population
Characterization of the U.S. Industrial Commercial Boiler Population
Characterization of the U.S. Industrial Commercial Boiler Population

Create successful ePaper yourself
Turn your PDF publications into a flip-book with our unique Google optimized e-Paper software.
Incremental <strong>Boiler</strong> Fuel (TBtu/year)<br />
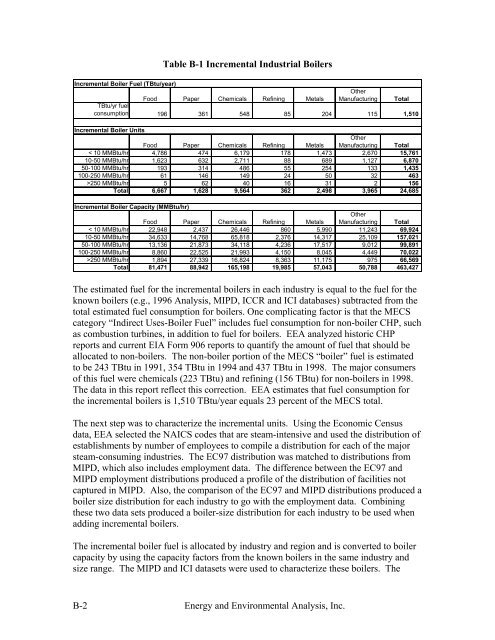
Table B-1 Incremental <strong>Industrial</strong> <strong>Boiler</strong>s<br />
Food Paper Chemicals Refining Metals<br />
TBtu/yr fuel<br />
consumption 196<br />
361<br />
548<br />
85<br />
204<br />
Incremental <strong>Boiler</strong> Units<br />
Food Paper Chemicals Refining Metals<br />
< 10 MMBtu/hr 4,786<br />
474 6,179<br />
178 1,473<br />
10-50 MMBtu/hr 1,623<br />
632 2,711<br />
88<br />
689<br />
50-100 MMBtu/hr 193<br />
314<br />
486<br />
55<br />
254<br />
100-250 MMBtu/hr 61<br />
146<br />
149<br />
24<br />
50<br />
>250 MMBtu/hr 5<br />
62<br />
40<br />
16<br />
31<br />
Total 6,667 1,628 9,564<br />
362 2,498<br />
Incremental <strong>Boiler</strong> Capacity (MMBtu/hr)<br />
Food Paper Chemicals Refining Metals<br />
< 10 MMBtu/hr 22,948 2,437 26,446<br />
860 5,990<br />
10-50 MMBtu/hr 34,633 14,768 65,818 2,376 14,317<br />
50-100 MMBtu/hr 13,136 21,873 34,118 4,236 17,517<br />
100-250 MMBtu/hr 8,860 22,525 21,993 4,150 8,045<br />
>250 MMBtu/hr 1,894 27,339 16,824 8,363 11,175<br />
Total 81,471 88,942 165,198 19,985 57,043<br />
B-2 Energy and Environmental Analysis, Inc.<br />
O<strong>the</strong>r<br />
Manufacturing Total<br />
115<br />
1,510<br />
O<strong>the</strong>r<br />
Manufacturing Total<br />
2,670 15,761<br />
1,127 6,870<br />
133 1,435<br />
32<br />
463<br />
2<br />
156<br />
3,965 24,685<br />
O<strong>the</strong>r<br />
Manufacturing Total<br />
11,243 69,924<br />
25,109 157,021<br />
9,012 99,891<br />
4,449 70,022<br />
975 66,569<br />
50,788 463,427<br />
The estimated fuel for <strong>the</strong> incremental boilers in each industry is equal to <strong>the</strong> fuel for <strong>the</strong><br />
known boilers (e.g., 1996 Analysis, MIPD, ICCR and ICI databases) subtracted from <strong>the</strong><br />
total estimated fuel consumption for boilers. One complicating factor is that <strong>the</strong> MECS<br />
category “Indirect Uses-<strong>Boiler</strong> Fuel” includes fuel consumption for non-boiler CHP, such<br />
as combustion turbines, in addition to fuel for boilers. EEA analyzed historic CHP<br />
reports and current EIA Form 906 reports to quantify <strong>the</strong> amount <strong>of</strong> fuel that should be<br />
allocated to non-boilers. The non-boiler portion <strong>of</strong> <strong>the</strong> MECS “boiler” fuel is estimated<br />
to be 243 TBtu in 1991, 354 TBtu in 1994 and 437 TBtu in 1998. The major consumers<br />
<strong>of</strong> this fuel were chemicals (223 TBtu) and refining (156 TBtu) for non-boilers in 1998.<br />
The data in this report reflect this correction. EEA estimates that fuel consumption for<br />
<strong>the</strong> incremental boilers is 1,510 TBtu/year equals 23 percent <strong>of</strong> <strong>the</strong> MECS total.<br />
The next step was to characterize <strong>the</strong> incremental units. Using <strong>the</strong> Economic Census<br />
data, EEA selected <strong>the</strong> NAICS codes that are steam-intensive and used <strong>the</strong> distribution <strong>of</strong><br />
establishments by number <strong>of</strong> employees to compile a distribution for each <strong>of</strong> <strong>the</strong> major<br />
steam-consuming industries. The EC97 distribution was matched to distributions from<br />
MIPD, which also includes employment data. The difference between <strong>the</strong> EC97 and<br />
MIPD employment distributions produced a pr<strong>of</strong>ile <strong>of</strong> <strong>the</strong> distribution <strong>of</strong> facilities not<br />
captured in MIPD. Also, <strong>the</strong> comparison <strong>of</strong> <strong>the</strong> EC97 and MIPD distributions produced a<br />
boiler size distribution for each industry to go with <strong>the</strong> employment data. Combining<br />
<strong>the</strong>se two data sets produced a boiler-size distribution for each industry to be used when<br />
adding incremental boilers.<br />
The incremental boiler fuel is allocated by industry and region and is converted to boiler<br />
capacity by using <strong>the</strong> capacity factors from <strong>the</strong> known boilers in <strong>the</strong> same industry and<br />
size range. The MIPD and ICI datasets were used to characterize <strong>the</strong>se boilers. The


