

Characterization of the U.S. Industrial Commercial Boiler Population
Characterization of the U.S. Industrial Commercial Boiler Population
Characterization of the U.S. Industrial Commercial Boiler Population

Create successful ePaper yourself
Turn your PDF publications into a flip-book with our unique Google optimized e-Paper software.
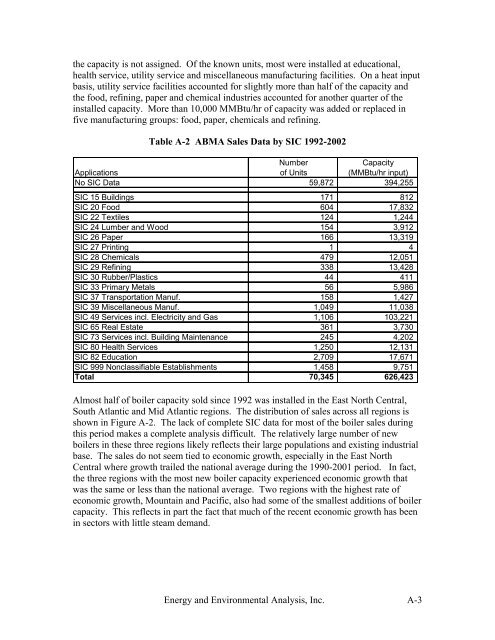
<strong>the</strong> capacity is not assigned. Of <strong>the</strong> known units, most were installed at educational,<br />
health service, utility service and miscellaneous manufacturing facilities. On a heat input<br />
basis, utility service facilities accounted for slightly more than half <strong>of</strong> <strong>the</strong> capacity and<br />
<strong>the</strong> food, refining, paper and chemical industries accounted for ano<strong>the</strong>r quarter <strong>of</strong> <strong>the</strong><br />
installed capacity. More than 10,000 MMBtu/hr <strong>of</strong> capacity was added or replaced in<br />
five manufacturing groups: food, paper, chemicals and refining.<br />
Table A-2 ABMA Sales Data by SIC 1992-2002<br />
Number Capacity<br />
Applications <strong>of</strong> Units (MMBtu/hr input)<br />
No SIC Data 59,872<br />
394,255<br />
SIC 15 Buildings 171<br />
SIC 20 Food 604<br />
SIC 22 Textiles 124<br />
SIC 24 Lumber and Wood 154<br />
SIC 26 Paper 166<br />
SIC 27 Printing 1<br />
SIC 28 Chemicals 479<br />
SIC 29 Refining 338<br />
SIC 30 Rubber/Plastics 44<br />
SIC 33 Primary Metals 56<br />
SIC 37 Transportation Manuf. 158<br />
SIC 39 Miscellaneous Manuf. 1,049<br />
SIC 49 Services incl. Electricity and Gas 1,106<br />
SIC 65 Real Estate 361<br />
SIC 73 Services incl. Building Maintenance 245<br />
SIC 80 Health Services 1,250<br />
SIC 82 Education 2,709<br />
SIC 999 Nonclassifiable Establishments 1,458<br />
Total 70,345<br />
812<br />
17,832<br />
1,244<br />
3,912<br />
13,319<br />
4<br />
12,051<br />
13,428<br />
411<br />
5,986<br />
1,427<br />
11,038<br />
103,221<br />
3,730<br />
4,202<br />
12,131<br />
17,671<br />
9,751<br />
626,423<br />
Almost half <strong>of</strong> boiler capacity sold since 1992 was installed in <strong>the</strong> East North Central,<br />
South Atlantic and Mid Atlantic regions. The distribution <strong>of</strong> sales across all regions is<br />
shown in Figure A-2. The lack <strong>of</strong> complete SIC data for most <strong>of</strong> <strong>the</strong> boiler sales during<br />
this period makes a complete analysis difficult. The relatively large number <strong>of</strong> new<br />
boilers in <strong>the</strong>se three regions likely reflects <strong>the</strong>ir large populations and existing industrial<br />
base. The sales do not seem tied to economic growth, especially in <strong>the</strong> East North<br />
Central where growth trailed <strong>the</strong> national average during <strong>the</strong> 1990-2001 period. In fact,<br />
<strong>the</strong> three regions with <strong>the</strong> most new boiler capacity experienced economic growth that<br />
was <strong>the</strong> same or less than <strong>the</strong> national average. Two regions with <strong>the</strong> highest rate <strong>of</strong><br />
economic growth, Mountain and Pacific, also had some <strong>of</strong> <strong>the</strong> smallest additions <strong>of</strong> boiler<br />
capacity. This reflects in part <strong>the</strong> fact that much <strong>of</strong> <strong>the</strong> recent economic growth has been<br />
in sectors with little steam demand.<br />
Energy and Environmental Analysis, Inc. A-3


