

Characterization of the U.S. Industrial Commercial Boiler Population
Characterization of the U.S. Industrial Commercial Boiler Population
Characterization of the U.S. Industrial Commercial Boiler Population

You also want an ePaper? Increase the reach of your titles
YUMPU automatically turns print PDFs into web optimized ePapers that Google loves.
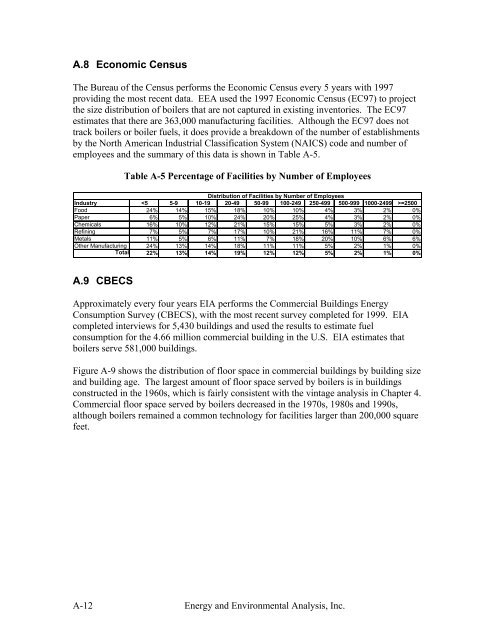
A.8 Economic Census<br />
The Bureau <strong>of</strong> <strong>the</strong> Census performs <strong>the</strong> Economic Census every 5 years with 1997<br />
providing <strong>the</strong> most recent data. EEA used <strong>the</strong> 1997 Economic Census (EC97) to project<br />
<strong>the</strong> size distribution <strong>of</strong> boilers that are not captured in existing inventories. The EC97<br />
estimates that <strong>the</strong>re are 363,000 manufacturing facilities. Although <strong>the</strong> EC97 does not<br />
track boilers or boiler fuels, it does provide a breakdown <strong>of</strong> <strong>the</strong> number <strong>of</strong> establishments<br />
by <strong>the</strong> North American <strong>Industrial</strong> Classification System (NAICS) code and number <strong>of</strong><br />
employees and <strong>the</strong> summary <strong>of</strong> this data is shown in Table A-5.<br />
Table A-5 Percentage <strong>of</strong> Facilities by Number <strong>of</strong> Employees<br />
Distribution <strong>of</strong> Facilities by Number <strong>of</strong> Employees<br />
Industry =2500<br />
Food 24% 14% 15% 18% 10% 10% 4% 3% 2% 0%<br />
Paper 6% 5% 10% 24% 20% 25% 4% 3% 2% 0%<br />
Chemicals 16% 10% 12% 21% 15% 15% 5% 3% 2% 0%<br />
Refining 7% 5% 7% 17% 10% 21% 16% 11% 7% 0%<br />
Metals 11% 5% 6% 11% 7% 18% 20% 10% 6% 6%<br />
O<strong>the</strong>r Manufacturing 24% 13% 14% 18% 11% 11% 5% 2% 1% 0%<br />
Total 22% 13% 14% 19% 12% 12% 5% 2% 1% 0%<br />
A.9 CBECS<br />
Approximately every four years EIA performs <strong>the</strong> <strong>Commercial</strong> Buildings Energy<br />
Consumption Survey (CBECS), with <strong>the</strong> most recent survey completed for 1999. EIA<br />
completed interviews for 5,430 buildings and used <strong>the</strong> results to estimate fuel<br />
consumption for <strong>the</strong> 4.66 million commercial building in <strong>the</strong> U.S. EIA estimates that<br />
boilers serve 581,000 buildings.<br />
Figure A-9 shows <strong>the</strong> distribution <strong>of</strong> floor space in commercial buildings by building size<br />
and building age. The largest amount <strong>of</strong> floor space served by boilers is in buildings<br />
constructed in <strong>the</strong> 1960s, which is fairly consistent with <strong>the</strong> vintage analysis in Chapter 4.<br />
<strong>Commercial</strong> floor space served by boilers decreased in <strong>the</strong> 1970s, 1980s and 1990s,<br />
although boilers remained a common technology for facilities larger than 200,000 square<br />
feet.<br />
A-12 Energy and Environmental Analysis, Inc.


