

Characterization of the U.S. Industrial Commercial Boiler Population
Characterization of the U.S. Industrial Commercial Boiler Population
Characterization of the U.S. Industrial Commercial Boiler Population

Create successful ePaper yourself
Turn your PDF publications into a flip-book with our unique Google optimized e-Paper software.
585 MMBtu/hr and 208 MMBtu/hr, respectively. Although few in number, <strong>the</strong> FBC and<br />
stoker boilers accounted for 8.5 percent <strong>of</strong> <strong>the</strong> boiler capacity sold during this period.<br />
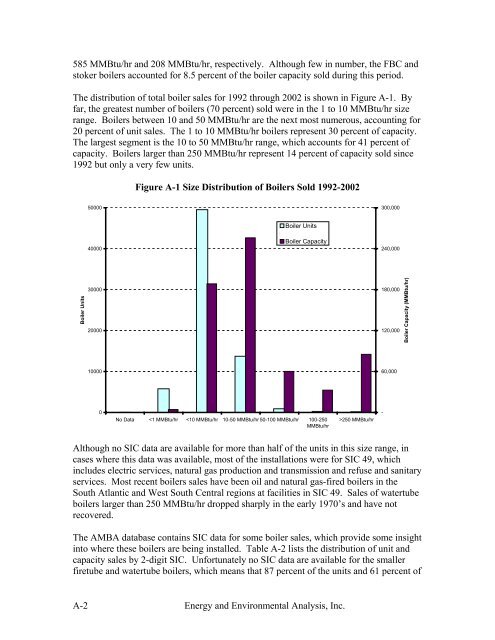
The distribution <strong>of</strong> total boiler sales for 1992 through 2002 is shown in Figure A-1. By<br />
far, <strong>the</strong> greatest number <strong>of</strong> boilers (70 percent) sold were in <strong>the</strong> 1 to 10 MMBtu/hr size<br />
range. <strong>Boiler</strong>s between 10 and 50 MMBtu/hr are <strong>the</strong> next most numerous, accounting for<br />
20 percent <strong>of</strong> unit sales. The 1 to 10 MMBtu/hr boilers represent 30 percent <strong>of</strong> capacity.<br />
The largest segment is <strong>the</strong> 10 to 50 MMBtu/hr range, which accounts for 41 percent <strong>of</strong><br />
capacity. <strong>Boiler</strong>s larger than 250 MMBtu/hr represent 14 percent <strong>of</strong> capacity sold since<br />
1992 but only a very few units.<br />
<strong>Boiler</strong> Units<br />
50000<br />
40000<br />
30000<br />
20000<br />
10000<br />
0<br />
Figure A-1 Size Distribution <strong>of</strong> <strong>Boiler</strong>s Sold 1992-2002<br />
<strong>Boiler</strong> Units<br />
<strong>Boiler</strong> Capacity<br />
No Data


