2012 Budget Book.indd - Metra
2012 Budget Book.indd - Metra
2012 Budget Book.indd - Metra

Create successful ePaper yourself
Turn your PDF publications into a flip-book with our unique Google optimized e-Paper software.
26<br />
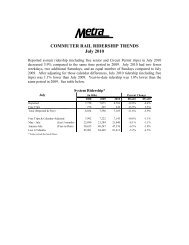
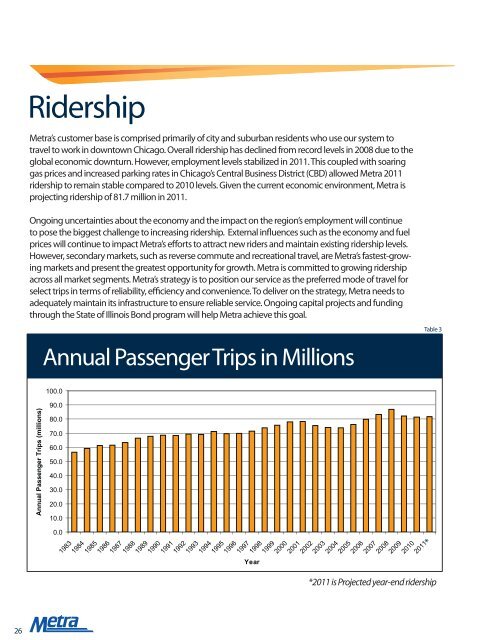
Ridership<br />
<strong>Metra</strong>’s customer base is comprised primarily of city and suburban residents who use our system to<br />
travel to work in downtown Chicago. Overall ridership has declined from record levels in 2008 due to the<br />
global economic downturn. However, employment levels stabilized in 2011. This coupled with soaring<br />
gas prices and increased parking rates in Chicago’s Central Business District (CBD) allowed <strong>Metra</strong> 2011<br />
ridership to remain stable compared to 2010 levels. Given the current economic environment, <strong>Metra</strong> is<br />
projecting ridership of 81.7 million in 2011.<br />
Ongoing uncertainties about the economy and the impact on the region’s employment will continue<br />
to pose the biggest challenge to increasing ridership. External in uences such as the economy and fuel<br />
prices will continue to impact <strong>Metra</strong>’s e orts to attract new riders and maintain existing ridership levels.<br />
However, secondary markets, such as reverse commute and recreational travel, are <strong>Metra</strong>’s fastest-growing<br />
markets and present the greatest opportunity for growth. <strong>Metra</strong> is committed to growing ridership<br />
across all market segments. <strong>Metra</strong>’s strategy is to position our service as the preferred mode of travel for<br />
select trips in terms of reliability, e ciency and convenience. To deliver on the strategy, <strong>Metra</strong> needs to<br />
adequately maintain its infrastructure to ensure reliable service. Ongoing capital projects and funding<br />
through the State of Illinois Bond program will help <strong>Metra</strong> achieve this goal.<br />
Annual Passenger Trips (millions)<br />
Annual Passenger Trips in Millions<br />
100.0<br />
90.0<br />
80.0<br />
70.0<br />
60.0<br />
50.0<br />
40.0<br />
30.0<br />
20.0<br />
10.0<br />
0.0<br />
1983<br />
1984<br />
1985<br />
1986<br />
1987<br />
1988<br />
1989<br />
1990<br />
1991<br />
1992<br />
1993<br />
1994<br />
1995<br />
1996<br />
1997<br />
1998<br />
Year<br />
1999<br />
2000<br />
2001<br />
2002<br />
2003<br />
2004<br />
2005<br />
2006<br />
2007<br />
2008<br />
2009<br />
2010<br />
2011<br />
Table 3<br />
*<br />
*2011 is Projected year-end ridership