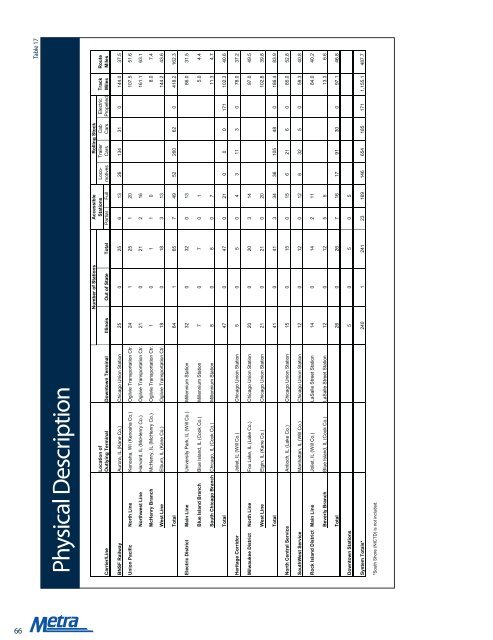
66 Table 17 Physical Description
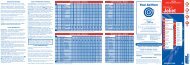
Table 18 Operating & Service Characteristics as of 2011 Operating Characteristics as of 2011 Train Car Average Scheduled Speeds On-Time Performance # Revenue Trains Miles Miles Weekday Weekday Weekend/ 2010 Jan-Jun11 Carrier/Line Weekday Sat Sun/Hol Jul10-Jun11 Jul10-Jun11 Peak Off-Peak Holiday Average Average BNSF Railway 94 28 18 948,961 6,964,051 35.1 31.2 29.2 95.2% 94.5% Union Pacific North 70 26 18 755,545 4,328,240 30.7 29.4 30.6 95.0% 93.6% Northwest 65 24 15 940,340 6,288,265 33.9 32.7 34.0 96.6% 95.1% West 59 20 18 699,052 4,734,548 32.0 31.1 31.2 94.5% 92.0% Total 194 70 51 2,394,937 15,351,053 95.4% 93.6% Electric District Main Line 79 46 20 726,776 3,764,696 23.9 23.0 23.1 97.1% 96.1% Blue Island 37 30 0 154,824 519,355 32.3 29.5 29.3 97.9% 98.2% So Chicago 54 48 20 227,985 890,368 20.2 20.2 20.6 98.6% 97.7% Total 170 124 40 1,109,585 5,174,419 97.8% 97.1% Heritage Corridor 6 0 0 57,144 265,836 35.2 -- -- 88.5% 91.5% Milwaukee District North 60 24 20 767,013 4,721,368 32.2 30.9 31.8 94.3% 90.6% West 58 24 18 661,349 4,472,337 29.6 29.4 29.8 96.0% 93.3% Total 118 48 38 1,428,362 9,193,705 95.1% 91.9% North Central Service 22 0 0 296,386 1,319,674 34.1 33.8 -- 93.2% 91.7% SouthWest Service 30 6 0 243,637 1,781,039 27.2 27.5 28.7 94.2% 92.6% Rock Island District 69 20 16 703,681 5,010,311 29.5 29.7 29.0 96.3% 94.3% System Totals/Averages* 703 296 163 7,182,693 45,060,088 31.5 29.8 29.7 95.9% 94.3% * South Shore (NICTD) is not included. 9/27/2011 # Due to changes in calculation methodology, on-time performance figures from May 2011 onward are not exactly comparable to prior months' figures. 67