2012 Budget Book.indd - Metra
2012 Budget Book.indd - Metra
2012 Budget Book.indd - Metra

You also want an ePaper? Increase the reach of your titles
YUMPU automatically turns print PDFs into web optimized ePapers that Google loves.
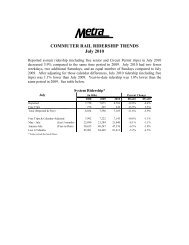
Forecasted Ridership and Vehicle Miles<br />
2011-2014<br />
Forecasted Ridership and Vehicle Miles / 2011-2014<br />
Passenger Trips 1<br />
2011<br />
2010 Year-End <strong>2012</strong> 2013 2014<br />
Actual Projected* Forecast Forecast Forecast<br />
BNSF Railway 16,286,000 16,377,000 16,200,000 16,443,000 16,690,000<br />
Union Pacific 28,183,000 28,111,000 27,807,000 28,224,000 28,648,000<br />
Electric District 10,039,000 10,000,000 9,892,000 10,040,000 10,191,000<br />
Heritage Corridor 695,000 699,000 692,000 702,000 713,000<br />
Milwaukee District 13,599,000 13,859,000 13,709,000 13,915,000 14,124,000<br />
North Central Service 1,585,000 1,604,000 1,587,000 1,611,000 1,635,000<br />
SouthWest Service 2,451,000 2,505,000 2,478,000 2,516,000 2,553,000<br />
Rock Island District 8,554,000 8,506,000 8,415,000 8,541,000 8,669,000<br />
System Total** 81,393,000 81,662,000 80,780,000 81,992,000 83,222,000<br />
Year-to-Year Change 0.3% -1.1% 1.5% 1.5%<br />
Passenger Miles 2<br />
BNSF Railway 372,404,000 374,954,000 370,904,000 376,468,000 382,115,000<br />
Union Pacific 597,969,000 592,588,000 586,188,000 594,980,000 603,905,000<br />
Electric District 184,338,000 184,307,000 182,316,000 185,051,000 187,827,000<br />
Heritage Corridor 19,211,000 19,250,000 19,042,000 19,327,000 19,617,000<br />
Milwaukee District 315,794,000 315,202,000 311,798,000 316,474,000 321,222,000<br />
North Central Service 48,214,000 48,942,000 48,414,000 49,140,000 49,877,000<br />
SouthWest Service 45,361,000 46,093,000 45,595,000 46,279,000 46,974,000<br />
Rock Island District 179,211,000 176,881,000 174,971,000 177,596,000 180,260,000<br />
System Total** 1,762,502,000 1,758,217,000 1,739,228,000 1,765,316,000 1,791,796,000<br />
Year-to-Year Change -0.2% -1.1% 1.5% 1.5%<br />
Revenue Car Miles<br />
BNSF Railway 6,293,000 6,228,000 6,259,000 6,255,000 6,255,000<br />
Union Pacific 14,949,000 14,811,000 14,860,000 14,848,000 14,848,000<br />
Electric District 4,864,000 4,779,000 4,800,000 4,795,000 4,795,000<br />
Heritage Corridor 266,000 264,000 265,000 265,000 265,000<br />
Milwaukee District 8,974,000 8,906,000 8,938,000 8,929,000 8,929,000<br />
North Central Service 1,320,000 1,302,000 1,308,000 1,308,000 1,308,000<br />
SouthWest Service 1,769,000 1,762,000 1,769,000 1,769,000 1,769,000<br />
Rock Island District 4,647,000 4,676,000 4,697,000 4,693,000 4,693,000<br />
System Total** 43,082,000 42,728,000 42,897,000 42,863,000 42,863,000<br />
Year-to-Year Change -0.8% 0.4% -0.1% 0.0%<br />
*Based on January-June actuals<br />
**South Shore (NICTD) is not included.<br />
1 - Based on Ticket Sales and Free Trips<br />
2 - Based on Ticket Sales but does not include Free Trips<br />
Note: Line estimates beginning in August 2010 may be affected by the implementation of a new revenue accounting system, which provide<br />
more precise line breakdowns than our previous systems were able to provide for passenger trips and passenger miles.<br />
Columns may not add exactly to System Totals due to rounding.<br />
Table 20<br />
69