HP·38E/38C - Slide Rule Museum
HP·38E/38C - Slide Rule Museum
HP·38E/38C - Slide Rule Museum

You also want an ePaper? Increase the reach of your titles
YUMPU automatically turns print PDFs into web optimized ePapers that Google loves.
72 Statistical Functions<br />
Linear Regression<br />
When you have a set of data points, it is often useful to find out how<br />
closely they are related to each other. If you find that the data points are<br />
closely related, they can help you make projections or estimates based on<br />
known data. Linear regression is a statistical method for defining a<br />
straight line that best fits a set of data points, thus providing a<br />
relationship between two variables.<br />
Since two points define a line, at least two data points must be in the<br />
calculator before a line can be drawn or fitted to them. After you have<br />
accumulated the data points using the [B key, you can quickly estimate<br />
other values. But these estimated values are not very reliable unless the<br />
original data can be described or generalized to a certain degree of<br />
accuracy.<br />
Correlation Coefficient<br />
It's a good idea to check the "goodness of fit" of the linear function, by<br />
calculating the correlation coefficient, before estimating other values.<br />
This will tell you how close to a straight line the data points lie.<br />
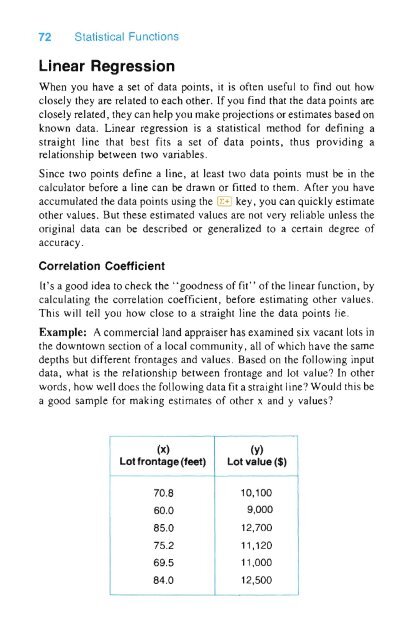
Example: A commercial land appraiser has examined six vacant lots in<br />
the downtown section of a local community, all of which have the same<br />
depths but different frontages and values. Based on the following input<br />
data, what is the relationship between frontage and lot value? In other<br />
words, how well does the following data fit a straight line? Would this be<br />
a good sample for making estimates of other x and y values?<br />
(x) (y)<br />
Lot frontage (feet) Lot value ($)<br />
70.8 10,100<br />
60.0 9,000<br />
85.0 12,700<br />
75.2 11 ,120<br />
69.5 11 ,000<br />
84.0 12,500