HP·38E/38C - Slide Rule Museum
HP·38E/38C - Slide Rule Museum
HP·38E/38C - Slide Rule Museum

You also want an ePaper? Increase the reach of your titles
YUMPU automatically turns print PDFs into web optimized ePapers that Google loves.
74 Statistical Functions<br />
An example of a negative trend is declining property values or declining<br />
sales. If r = 0, the data values are spread out and do not come close to a<br />
straight line. It would be useless to find linear estimates from unrelated<br />
data.<br />
In the example of lot frontage related to value, the correlation coefficient<br />
is close to I, so we can feel comfortable using linear regression.<br />
Suppose, though, that the correlation coefficient was not close to I but<br />
instead was 0.5 or 0.6. This would indicate that a straight line is not a<br />
very good fit to the data. Then you might try to fit a curve to the data.<br />
Refer to the applications books for a description of three other types of<br />
curves: exponential, logarithmic, and power. A correlation coefficient<br />
can be calculated for each of these curves and should be interpreted<br />
similarly: if r is close to ± I , the curve is a reasonable approximation of<br />
the data. If not, try a different curve.<br />
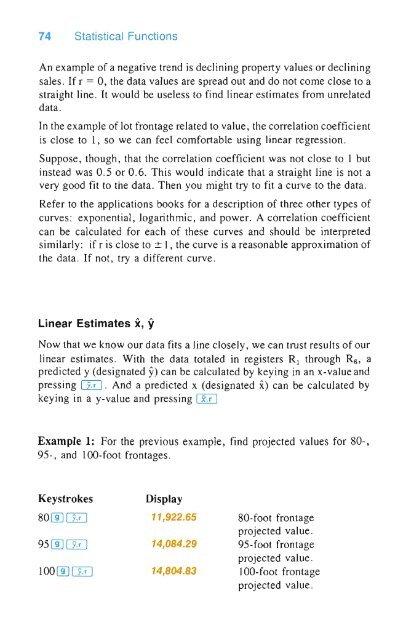
Linear Estimates X, y<br />
Now that we know our data fits a line closely, we can trust results of our<br />
linear estimates. With the data totaled in registers Rl through R 6 , a<br />
predicted y (designated 9) can be calculated by keying in an x-value and<br />
pressing [I!J . And a predicted x (designated x) can be calculated by<br />
keying in a y-value and pressing I x,r I<br />
Example 1: For the previous example, find projected values for 80-,<br />
95- , and loo-foot frontages.<br />
Keystrokes<br />
80 1]] [I!J<br />
1001]][I!J<br />
Display<br />
11,922.65<br />
14,084.29<br />
14,804.83<br />
80-foot frontage<br />
projected value.<br />
95-foot frontage<br />
projected value.<br />
100-foot frontage<br />
projected value .