Download the full book in PDF format - Eumed.net
Download the full book in PDF format - Eumed.net
Download the full book in PDF format - Eumed.net

Create successful ePaper yourself
Turn your PDF publications into a flip-book with our unique Google optimized e-Paper software.
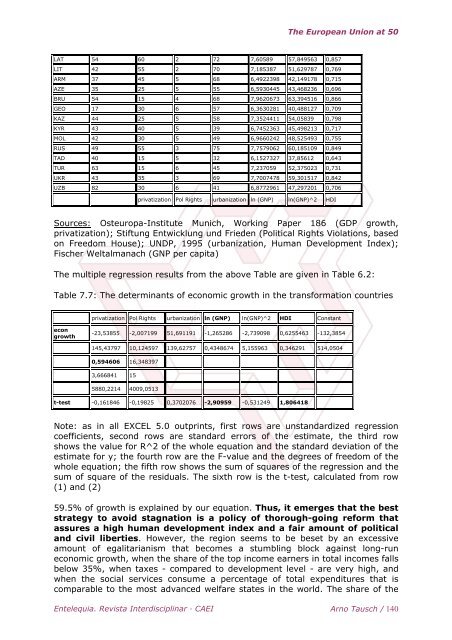
LAT 54 60 2 72 7,60589 57,849563 0,857<br />
LIT 42 55 2 70 7,185387 51,629787 0,769<br />
ARM 37 45 5 68 6,4922398 42,149178 0,715<br />
AZE 35 25 5 55 6,5930445 43,468236 0,696<br />
BRU 54 15 4 68 7,9620673 63,394516 0,866<br />
GEO 17 30 6 57 6,3630281 40,488127 0,709<br />
KAZ 44 25 5 58 7,3524411 54,05839 0,798<br />
KYR 43 40 5 39 6,7452363 45,498213 0,717<br />
MOL 42 30 5 49 6,9660242 48,525493 0,755<br />
RUS 49 55 3 75 7,7579062 60,185109 0,849<br />
TAD 40 15 5 32 6,1527327 37,85612 0,643<br />
TUR 63 15 6 45 7,237059 52,375023 0,731<br />
UKR 43 35 3 69 7,7007478 59,301517 0,842<br />
UZB 82 30 6 41 6,8772961 47,297201 0,706<br />
privatization Pol Rights urbanization ln (GNP) ln(GNP)^2 HDI<br />
The European Union at 50<br />
Sources: Osteuropa-Institute Munich, Work<strong>in</strong>g Paper 186 (GDP growth,<br />
privatization); Stiftung Entwicklung und Frieden (Political Rights Violations, based<br />
on Freedom House); UNDP, 1995 (urbanization, Human Development Index);<br />
Fischer Weltalmanach (GNP per capita)<br />
The multiple regression results from <strong>the</strong> above Table are given <strong>in</strong> Table 6.2:<br />
Table 7.7: The determ<strong>in</strong>ants of economic growth <strong>in</strong> <strong>the</strong> trans<strong>format</strong>ion countries<br />
econ<br />
growth<br />
privatization Pol Rights urbanization ln (GNP) ln(GNP)^2 HDI Constant<br />
-23,53855 -2,007199 51,691191 -1,265286 -2,739098 0,6255463 -132,3854<br />
145,43797 10,124597 139,62757 0,4348674 5,155963 0,346291 514,0504<br />
0,594606 16,348397<br />
3,666841 15<br />
5880,2214 4009,0513<br />
t-test -0,161846 -0,19825 0,3702076 -2,90959 -0,531249 1,806418<br />
Note: as <strong>in</strong> all EXCEL 5.0 outpr<strong>in</strong>ts, first rows are unstandardized regression<br />
coefficients, second rows are standard errors of <strong>the</strong> estimate, <strong>the</strong> third row<br />
shows <strong>the</strong> value for R^2 of <strong>the</strong> whole equation and <strong>the</strong> standard deviation of <strong>the</strong><br />
estimate for y; <strong>the</strong> fourth row are <strong>the</strong> F-value and <strong>the</strong> degrees of freedom of <strong>the</strong><br />
whole equation; <strong>the</strong> fifth row shows <strong>the</strong> sum of squares of <strong>the</strong> regression and <strong>the</strong><br />
sum of square of <strong>the</strong> residuals. The sixth row is <strong>the</strong> t-test, calculated from row<br />
(1) and (2)<br />
59.5% of growth is expla<strong>in</strong>ed by our equation. Thus, it emerges that <strong>the</strong> best<br />
strategy to avoid stagnation is a policy of thorough-go<strong>in</strong>g reform that<br />
assures a high human development <strong>in</strong>dex and a fair amount of political<br />
and civil liberties. However, <strong>the</strong> region seems to be beset by an excessive<br />
amount of egalitarianism that becomes a stumbl<strong>in</strong>g block aga<strong>in</strong>st long-run<br />
economic growth, when <strong>the</strong> share of <strong>the</strong> top <strong>in</strong>come earners <strong>in</strong> total <strong>in</strong>comes falls<br />
below 35%, when taxes - compared to development level - are very high, and<br />
when <strong>the</strong> social services consume a percentage of total expenditures that is<br />
comparable to <strong>the</strong> most advanced welfare states <strong>in</strong> <strong>the</strong> world. The share of <strong>the</strong><br />
Entelequia. Revista Interdiscipl<strong>in</strong>ar · CAEI Arno Tausch / 140