Birds in southern Öresund in relation to the wind farm at ... - Vattenfall
Birds in southern Öresund in relation to the wind farm at ... - Vattenfall
Birds in southern Öresund in relation to the wind farm at ... - Vattenfall

Create successful ePaper yourself
Turn your PDF publications into a flip-book with our unique Google optimized e-Paper software.
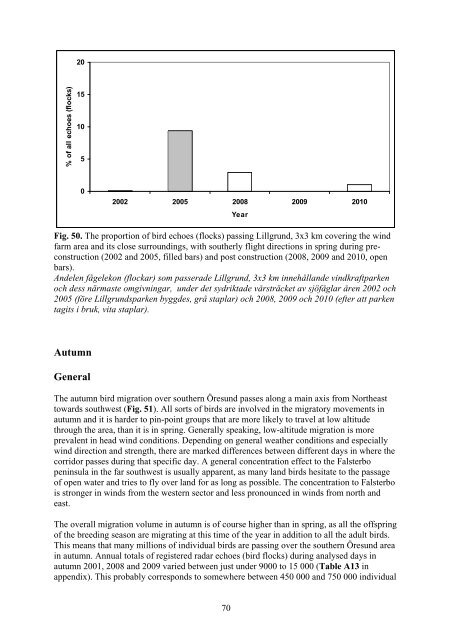
% of all echoes (flocks)<br />
20<br />
15<br />
10<br />
5<br />
0<br />
2002 2005 2008<br />
Year<br />
2009 2010<br />
Fig. 50. The proportion of bird echoes (flocks) pass<strong>in</strong>g Lillgrund, 3x3 km cover<strong>in</strong>g <strong>the</strong> w<strong>in</strong>d<br />
<strong>farm</strong> area and its close surround<strong>in</strong>gs, with sou<strong>the</strong>rly flight directions <strong>in</strong> spr<strong>in</strong>g dur<strong>in</strong>g preconstruction<br />
(2002 and 2005, filled bars) and post construction (2008, 2009 and 2010, open<br />
bars).<br />
Andelen fågelekon (flockar) som passerade Lillgrund, 3x3 km <strong>in</strong>nehållande v<strong>in</strong>dkraftparken<br />
och dess närmaste omgivn<strong>in</strong>gar, under det sydriktade vårsträcket av sjöfåglar åren 2002 och<br />
2005 (före Lillgrundsparken byggdes, grå staplar) och 2008, 2009 och 2010 (efter <strong>at</strong>t parken<br />
tagits i bruk, vita staplar).<br />
Autumn<br />
General<br />
The autumn bird migr<strong>at</strong>ion over <strong>sou<strong>the</strong>rn</strong> <strong>Öresund</strong> passes along a ma<strong>in</strong> axis from Nor<strong>the</strong>ast<br />
<strong>to</strong>wards southwest (Fig. 51). All sorts of birds are <strong>in</strong>volved <strong>in</strong> <strong>the</strong> migra<strong>to</strong>ry movements <strong>in</strong><br />
autumn and it is harder <strong>to</strong> p<strong>in</strong>-po<strong>in</strong>t groups th<strong>at</strong> are more likely <strong>to</strong> travel <strong>at</strong> low altitude<br />
through <strong>the</strong> area, than it is <strong>in</strong> spr<strong>in</strong>g. Generally speak<strong>in</strong>g, low-altitude migr<strong>at</strong>ion is more<br />
prevalent <strong>in</strong> head w<strong>in</strong>d conditions. Depend<strong>in</strong>g on general wea<strong>the</strong>r conditions and especially<br />
w<strong>in</strong>d direction and strength, <strong>the</strong>re are marked differences between different days <strong>in</strong> where <strong>the</strong><br />
corridor passes dur<strong>in</strong>g th<strong>at</strong> specific day. A general concentr<strong>at</strong>ion effect <strong>to</strong> <strong>the</strong> Falsterbo<br />
pen<strong>in</strong>sula <strong>in</strong> <strong>the</strong> far southwest is usually apparent, as many land birds hesit<strong>at</strong>e <strong>to</strong> <strong>the</strong> passage<br />
of open w<strong>at</strong>er and tries <strong>to</strong> fly over land for as long as possible. The concentr<strong>at</strong>ion <strong>to</strong> Falsterbo<br />
is stronger <strong>in</strong> w<strong>in</strong>ds from <strong>the</strong> western sec<strong>to</strong>r and less pronounced <strong>in</strong> w<strong>in</strong>ds from north and<br />
east.<br />
The overall migr<strong>at</strong>ion volume <strong>in</strong> autumn is of course higher than <strong>in</strong> spr<strong>in</strong>g, as all <strong>the</strong> offspr<strong>in</strong>g<br />
of <strong>the</strong> breed<strong>in</strong>g season are migr<strong>at</strong><strong>in</strong>g <strong>at</strong> this time of <strong>the</strong> year <strong>in</strong> addition <strong>to</strong> all <strong>the</strong> adult birds.<br />
This means th<strong>at</strong> many millions of <strong>in</strong>dividual birds are pass<strong>in</strong>g over <strong>the</strong> <strong>sou<strong>the</strong>rn</strong> <strong>Öresund</strong> area<br />
<strong>in</strong> autumn. Annual <strong>to</strong>tals of registered radar echoes (bird flocks) dur<strong>in</strong>g analysed days <strong>in</strong><br />
autumn 2001, 2008 and 2009 varied between just under 9000 <strong>to</strong> 15 000 (Table A13 <strong>in</strong><br />
appendix). This probably corresponds <strong>to</strong> somewhere between 450 000 and 750 000 <strong>in</strong>dividual<br />
70