October 31, 1975 - Gerald R. Ford Presidential Library and Museum
October 31, 1975 - Gerald R. Ford Presidential Library and Museum
October 31, 1975 - Gerald R. Ford Presidential Library and Museum
You also want an ePaper? Increase the reach of your titles
YUMPU automatically turns print PDFs into web optimized ePapers that Google loves.
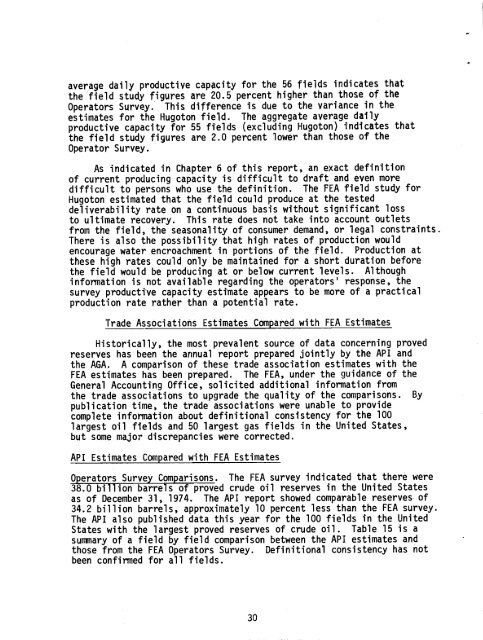
average daily productive capacity for the 56 fields indicates that<br />
the field study figures are 20.5 percent higher than those of the<br />
Operators Survey. This difference is due to the variance in the<br />
estimates for the Hugoton field. The aggregate average daily<br />
productive capacity for 55 fields (excluding Hugoton) indicates that<br />
the field study figures are 2.0 percent lower than those of the<br />
Operator Survey •.<br />
As indicated in Chapter 6 of this report, an exact definition<br />
of current producing capacity is difficult to draft <strong>and</strong> even more<br />
difficult to persons who use the definition. The FEA field study for<br />
Hugoton estimated that the fie1d could produce at the tested<br />
de1iverabi1ity rate on a continuous basis without significant loss<br />
to ultimate recovery. This rate does not take into account outlets<br />
from the field, the seasonality of consumer dem<strong>and</strong>, or 1egal constraints.<br />
There is also the possibility that high rates of production would<br />
encourage water encroachment in portions of the field. Production at<br />
these high rates could only be maintained for a short duration before<br />
the field would be producing at or below current levels. Although<br />
information is not available regarding the operators· response, the<br />
survey productive capacity estimate appears to be more of a practical<br />
production rate rather than a potential rate.<br />
Trade Associations Estimates Compared with FEA Estimates<br />
Historically, the most prevalent source of data concerning proved<br />
reserves has been the annual report prepared jointly by the API <strong>and</strong><br />
the AGA. A comparison of these trade association estimates with the<br />
FEA estimates has been prepared. The FEA, under the guidance of the<br />
General Accounting Office, solicited additional information from<br />
the trade associations to upgrade the quality of the comparisons. By<br />
publication time, the trade associations were unable to provide<br />
complete information about definitional consistency for the 100<br />
largest oil fields <strong>and</strong> 50 largest gas fields in the United States,<br />
but some major discrepancies were corrected.<br />
API Estimates Compared withFEA Estimates<br />
Operators Survey Comparisons. The FEA survey indicated that there were<br />
38.0 billion barrels of proved crude oil reserves in the United States<br />
as of December <strong>31</strong>, 1974. The API report showed comparable reserves· of<br />
34.2 billion barrels, approximately 10 percent less than the FEA survey.<br />
The API also published data this year for the 100 fields in the United<br />
States with the largest proved reserves of crude oil. Table 15 is a<br />
summary of a field by field comparison between the API estimates <strong>and</strong><br />
those from the FEA Operators Survey. Definitional consistency has not<br />
been confirmed for all fields.<br />
30


